
A Free Trading Journal
that Improves Discipline
100% FreeNo CC Required
4.8/5 1,794 Reviews


Product features
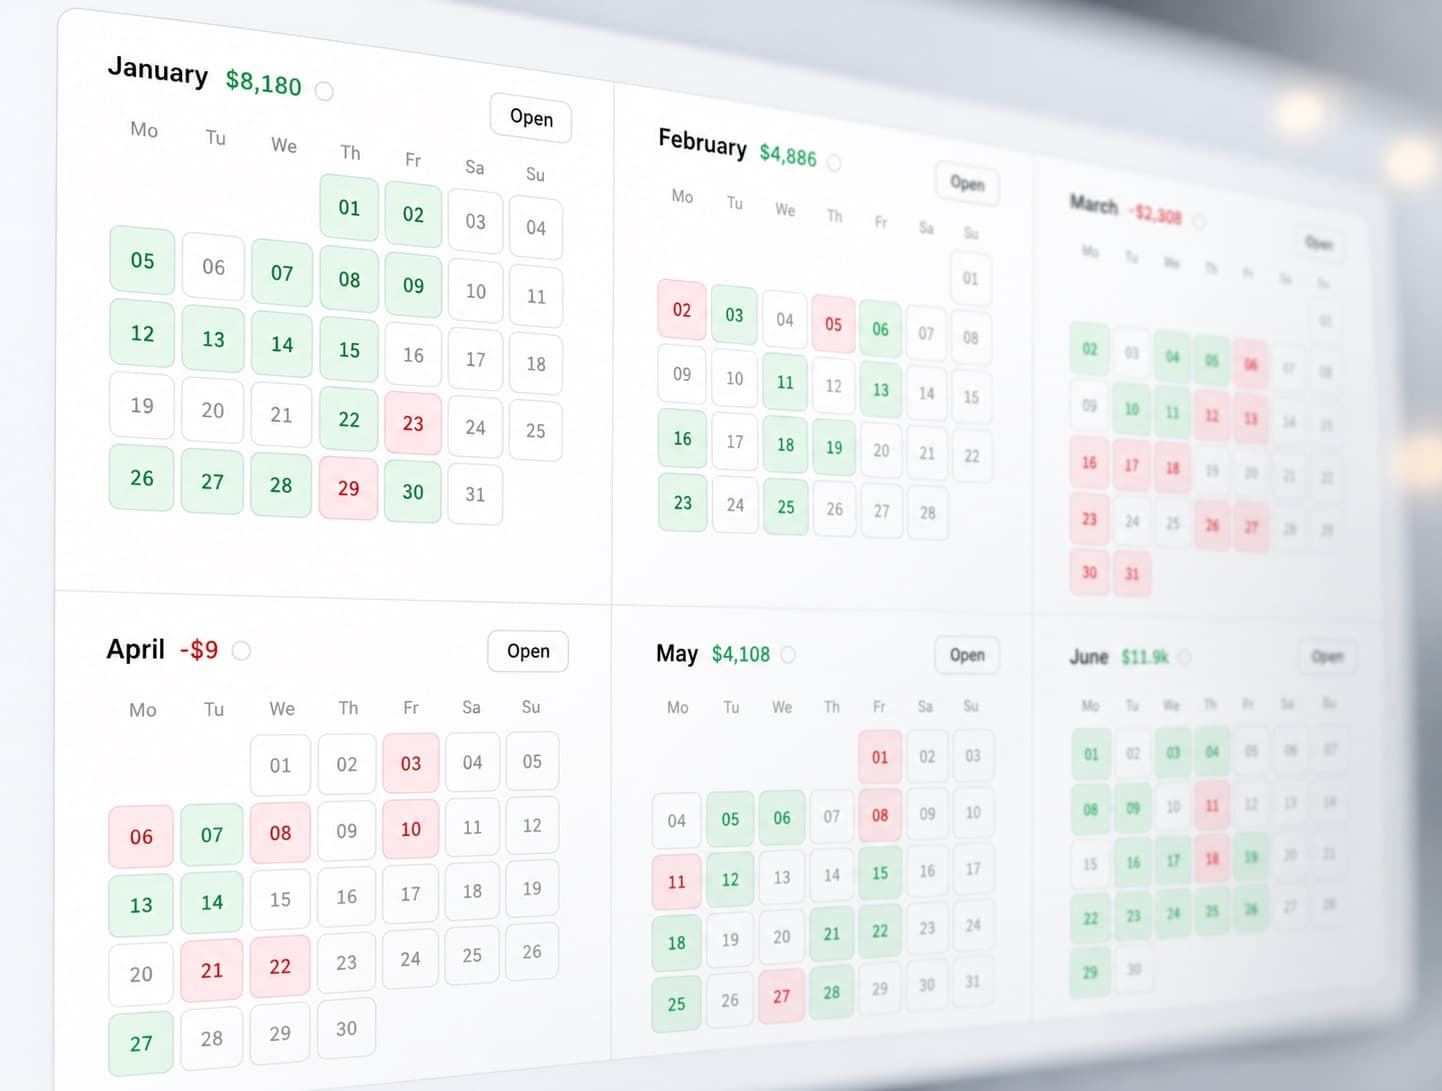
Can't Stop Overtrading?
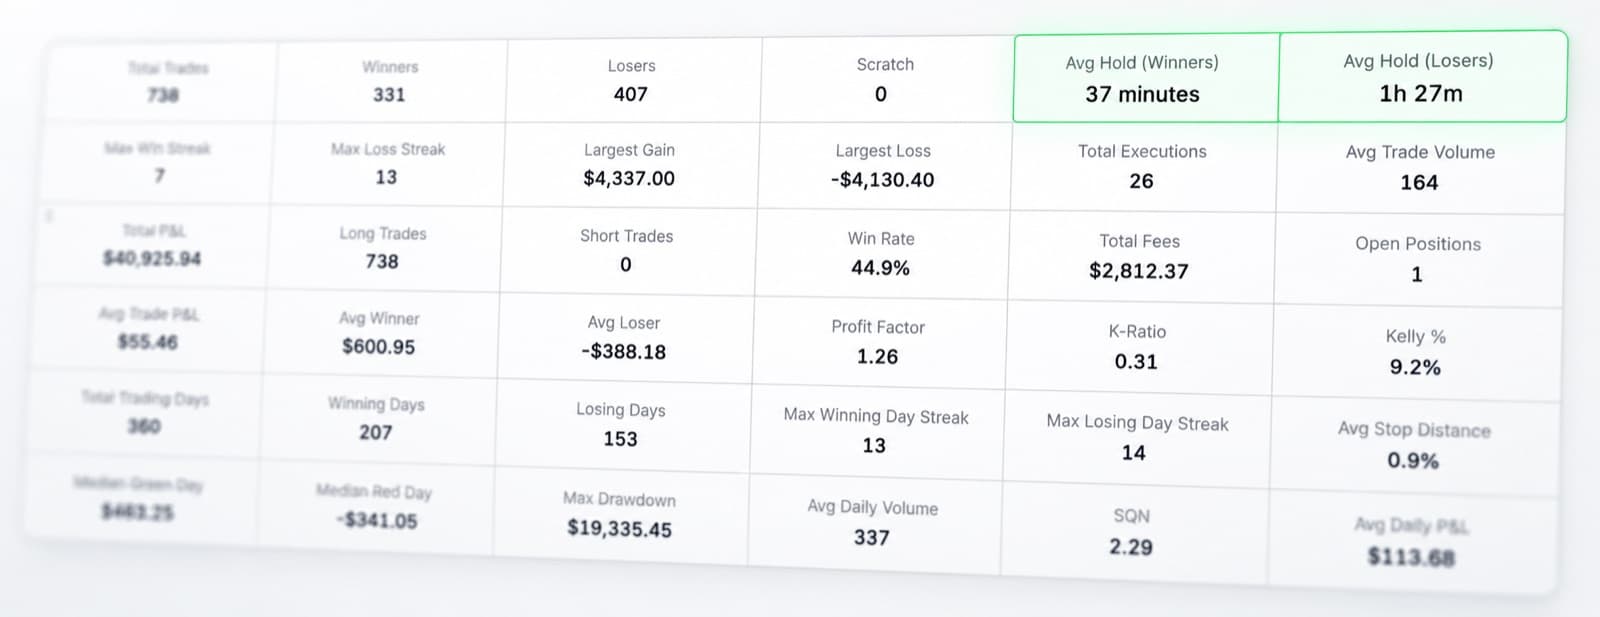
Use daily stats, tags, and calendars to see when "one more trade" turns green days red.
Mark boredom trades and revenge overtrading so you can build clear stop rules for each trading day.
Learn more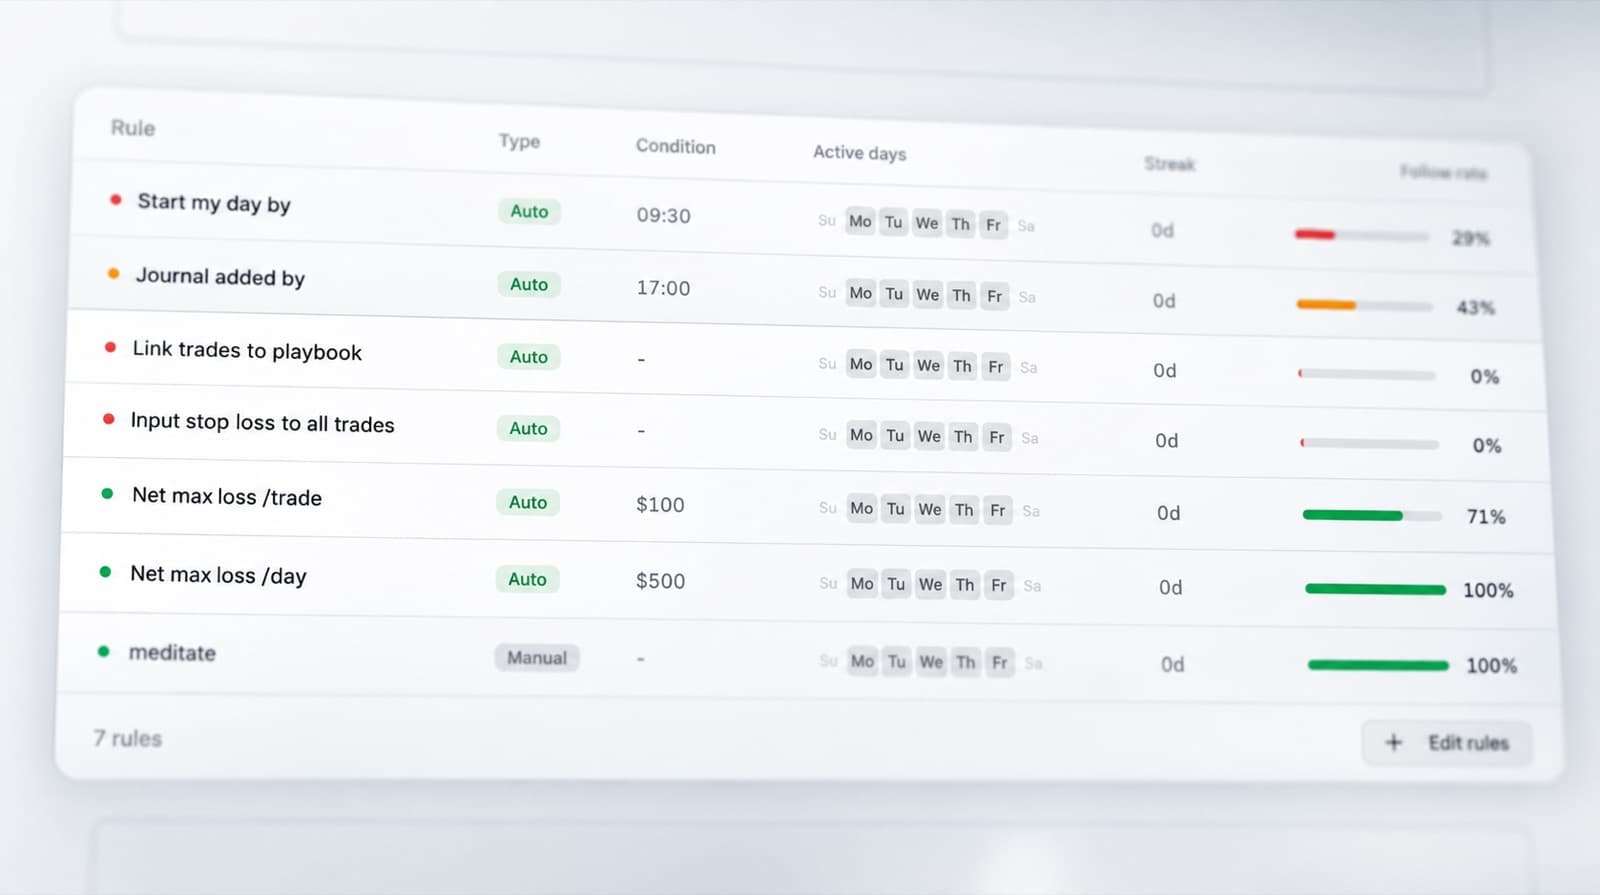
Struggling with Discipline & Consistency?
Turn your playbook into a checklist you can track and follow.
Use tags, notes, and sessions to track if you stuck to your rules on every trade so you can repeat the same process daily.
Learn more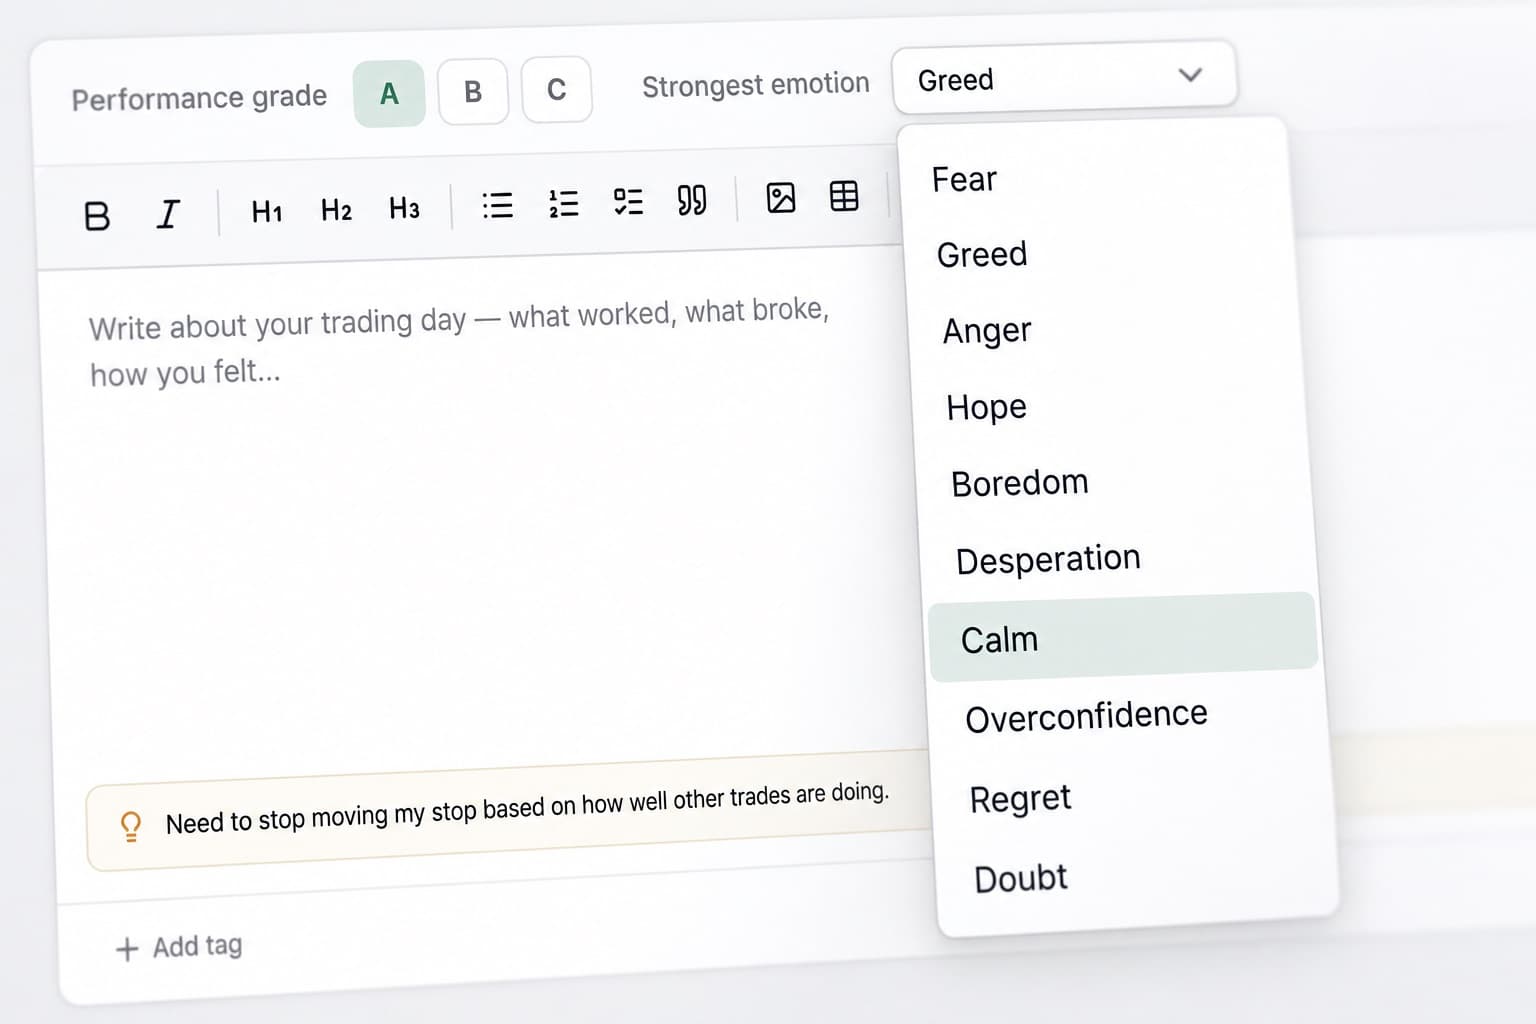
Emotions Sabotaging Your Trades?
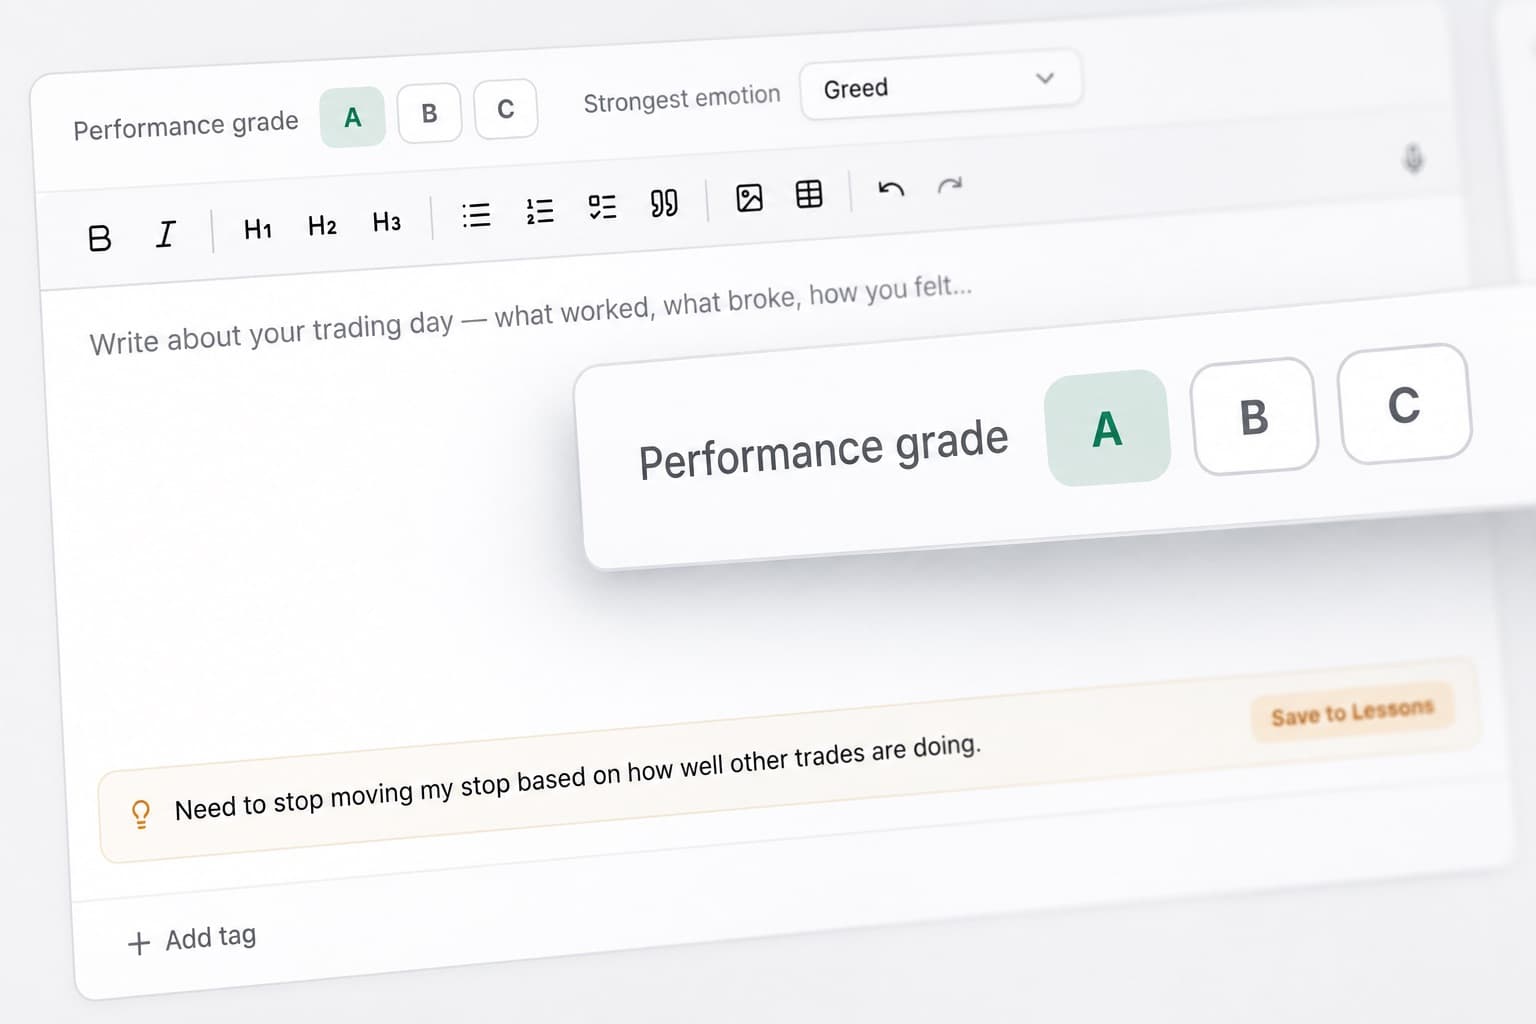
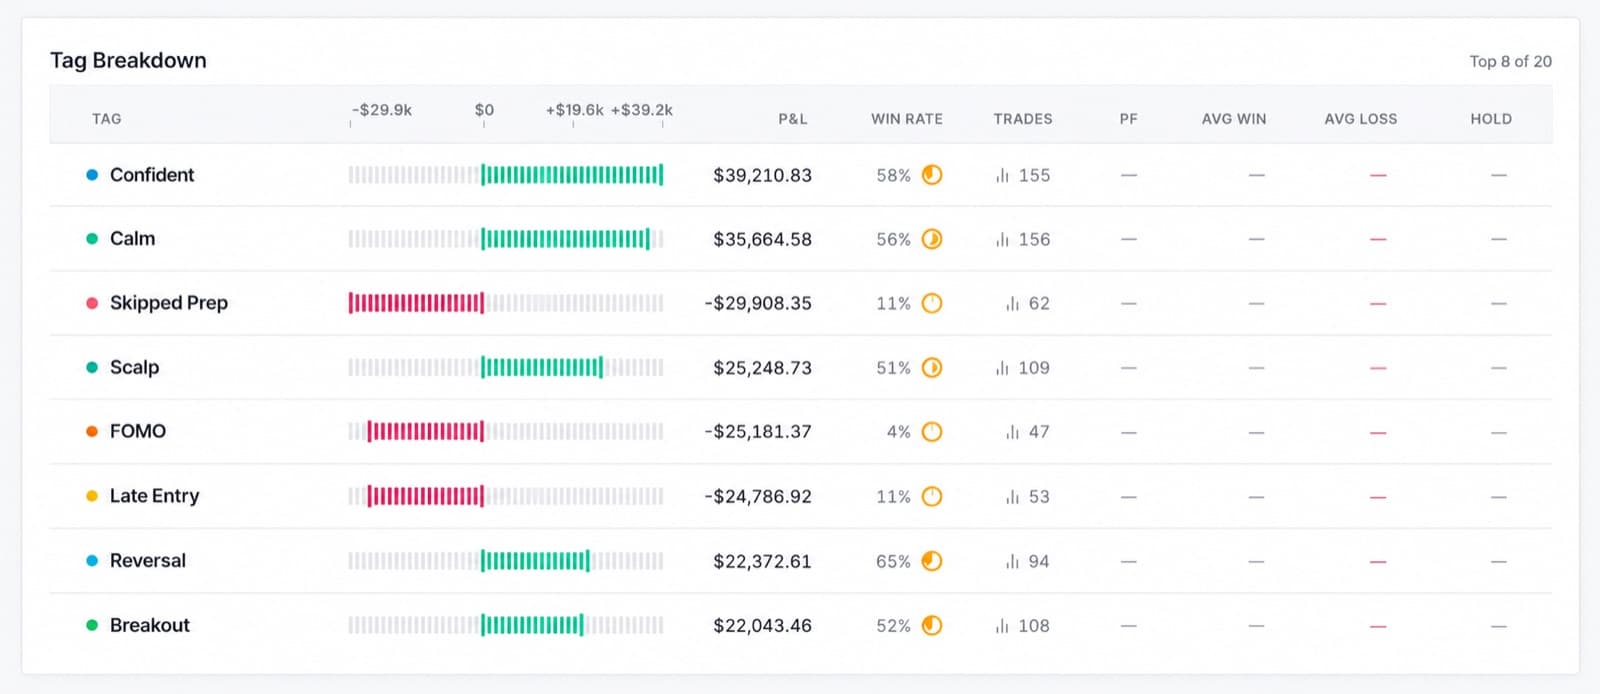
Emotion tags track revenge trades and rule-breaking.
Identify what is the biggest challenge to your trading psychology. Then simulate your P&L without these to understand how they are holding you back.
Learn more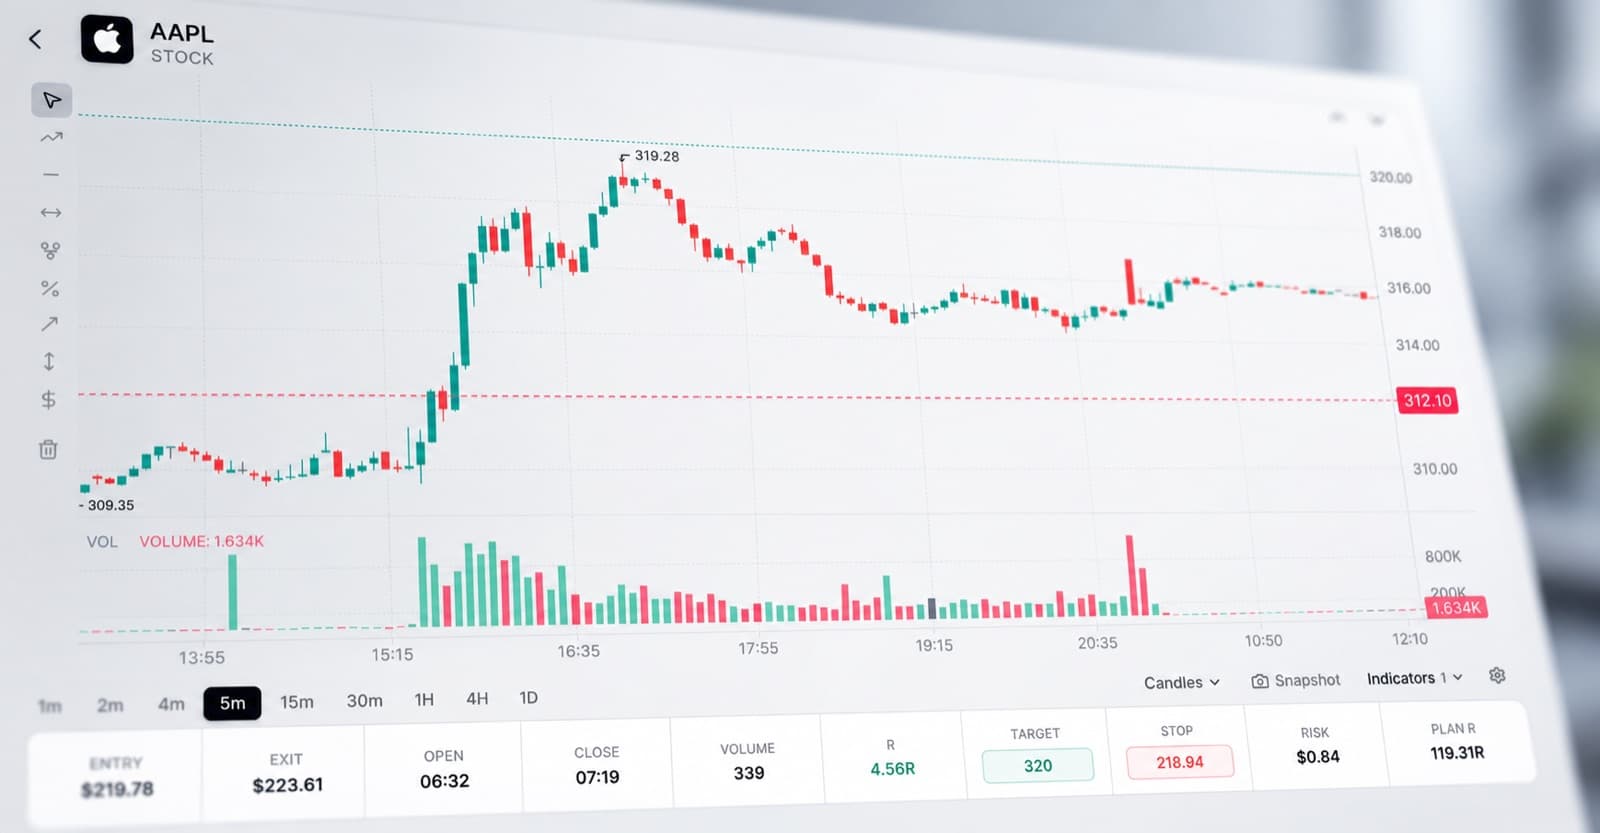
Fix Risk Management before you blow your account
Track stops, profit targets and daily P&L to learn when to cut losers.
Adjust stops, or how to size up safely. Prevent one red day undoing weeks of great trading.
Learn more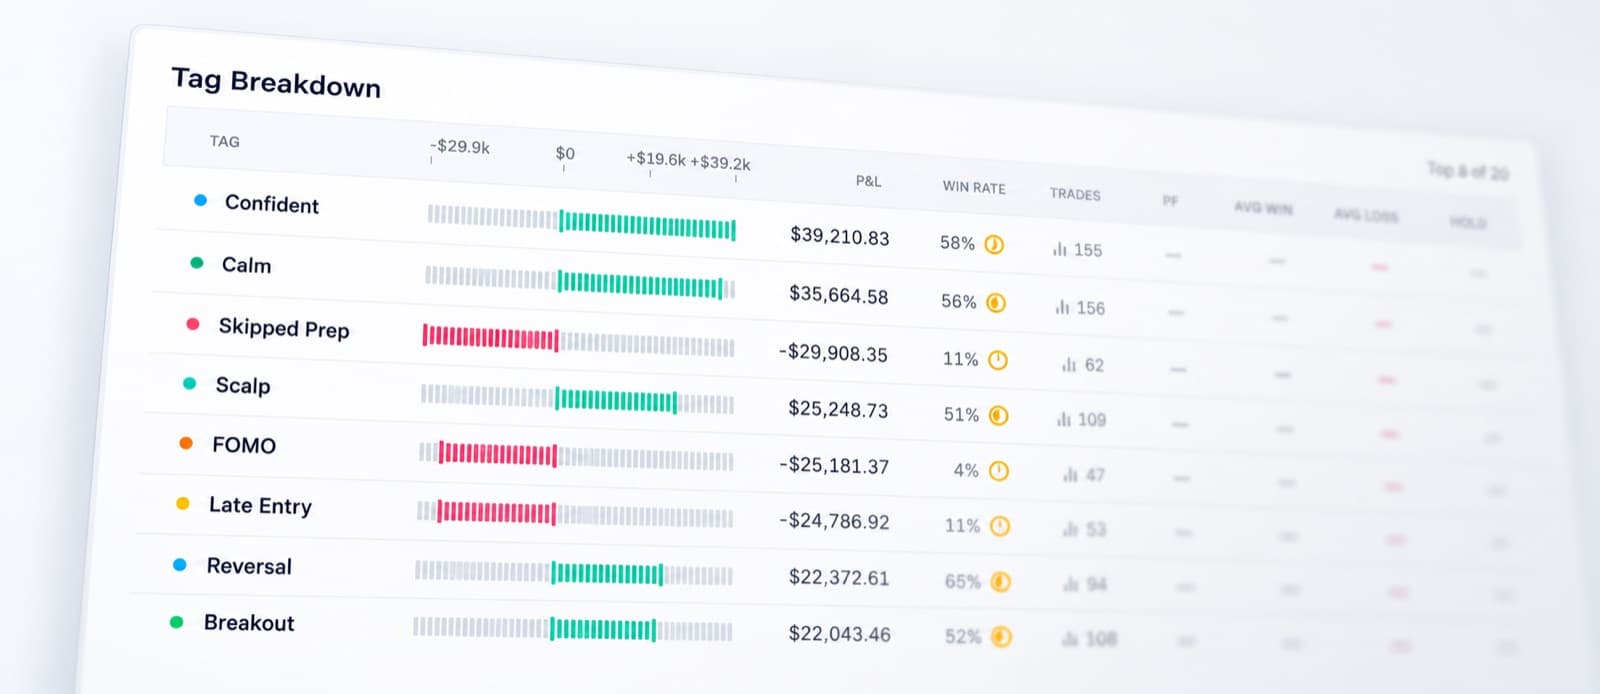
Adjust Your Trading Strategy
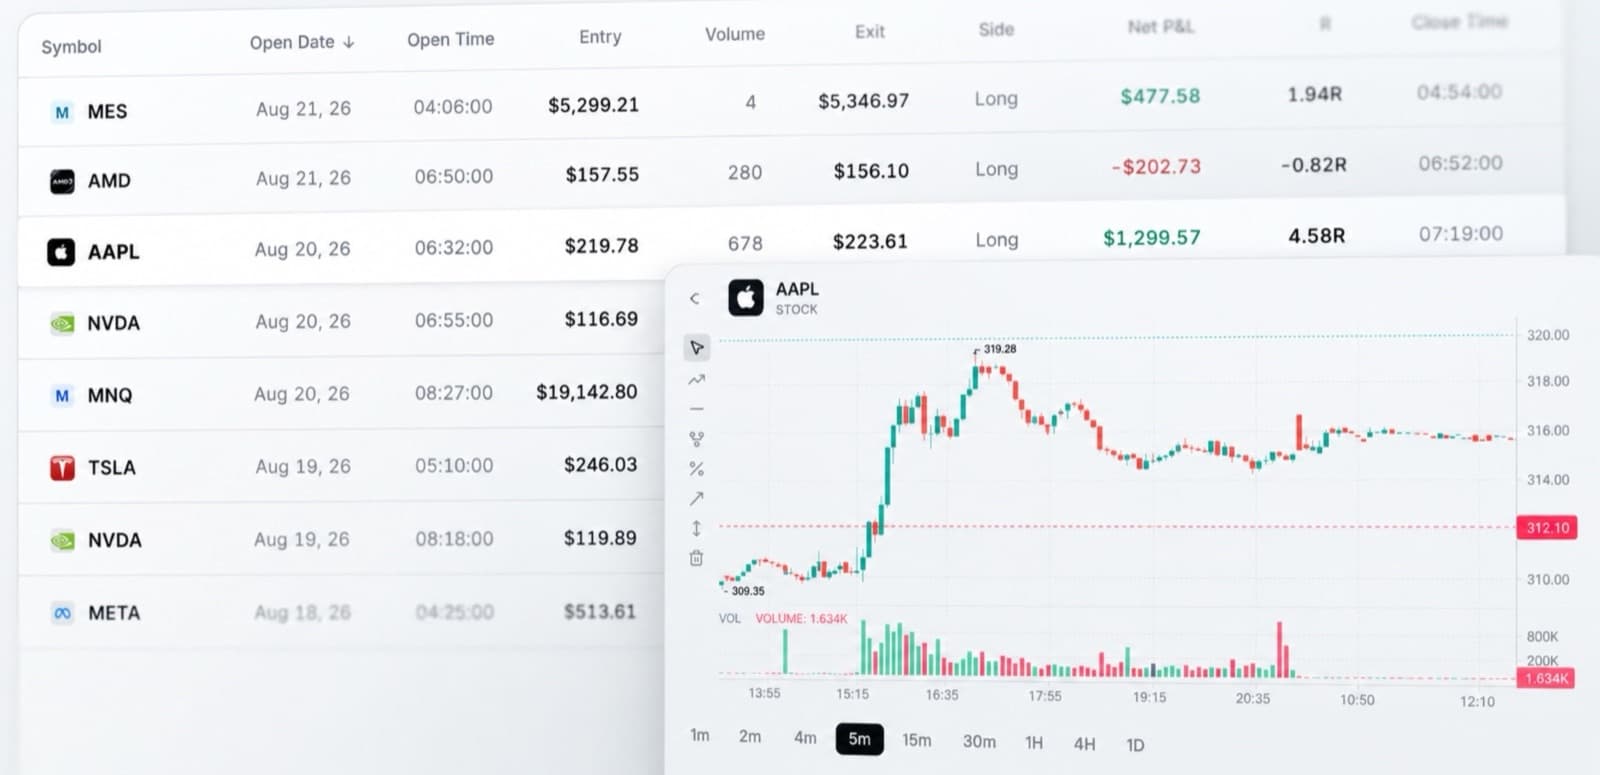
Visualise all entry and exit trading points.
Discover which setup is working and which one isn't. Use data such as best/worst day of the week to know when to trade aggressive or defensive.
Learn more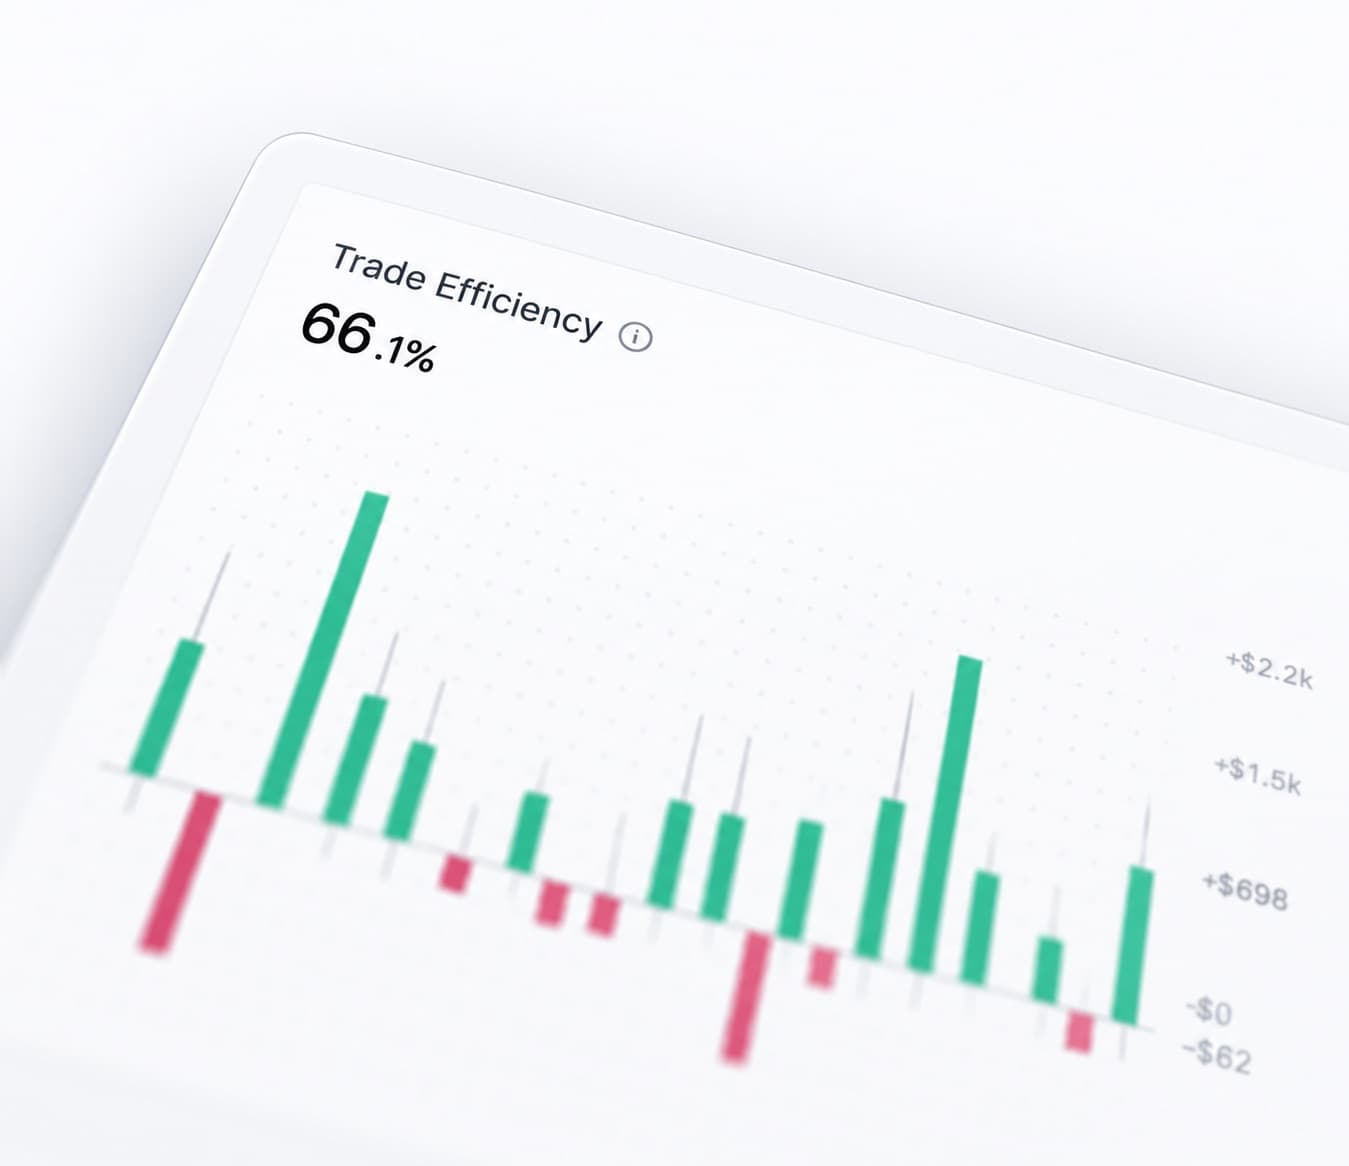
Cutting Winners Too Early?
Most traders struggle with letting winners run, especially as position size increases.
RizeTrade exit analysis shows you exactly how much money early exits are costing you. Develop the confidence to hold winners for longer.
Learn more

Testimonials
Trusted by traders
who take it seriously
“It was so easy to get started. Really love the post import summaries, makes my daily journal workflow so convenient.”
“Such a great experience. The team has always been responsive to my questions and they showed me the exact trading metrics I needed to focus to start improving.”
“I've tried journalling in the past but RizeTrade really was a breakthrough for me. The UI is very modern, clean and easy to read and I got some great insights after my first trades were added.”

Pricing
Simple, transparent pricing
Free
The full trading journal, free forever.
No card required
- Unlimited trades and trading accounts
- Unlimited imports
- P&L calendar and analytics
- Discipline Tracker
- Consistency Tracker with Heat Map
- Track emotions
- Strategy Performance Tracker
- Trading Playbook with Rule Follow Scoring
- View all past trades on chart
- Track stops and take profits
Blog
Latest articles
Trading strategies, risk management, and market analysis from the Rize team.
Where to trade
Find the right broker for your trading
Already have a broker, or looking for a new one? Find out which brokers work with RizeTrade, compare your options, and choose an account that fits your markets, trading style and budget.
Already have a trading account?
Already trading somewhere? Check whether your broker connects to RizeTrade before opening another account. Our supported broker list shows which brokers support automatic trade syncing, which require a file import, and how to get your trading history into your journal.
Opening a new trading account?
Opening your first account or thinking about switching? Our best brokers list ranks them on fees, available markets, trading platforms and minimum deposits. Find out which ones offer what you need without signing up for five accounts to find out.
Looking to switch brokers?
Stuck between two brokers? Compare Brokers on every metric that matters: trading costs, available markets, platform features and account requirements. See exactly what you'd gain or give up by choosing one over the other.
Need a broker specifically for intra-day?
Small differences in commissions, spreads and execution can add up quickly. See a breakdown by trading costs, order types, execution tools, short-selling access and market data to find the best day trading broker for your trading style.
Trading futures or micro contracts?
Trading the ES, NQ, micros or other futures contracts? Your Futures broker determines how much capital you need to open a position and what each round trip costs. Compare intraday and overnight margins, commissions, exchange and data fees, and platform compatibility before funding your account.
Trading options or multi-leg strategies?
Trading single-leg options or multi-leg strategies? Picking the best option broker affects which strategies you can trade, the tools available to manage them and how much each position costs. Compare options approval requirements, contract fees, strategy-building tools and exercise and assignment policies.
Want to get funded?
Want access to a larger trading account without depositing the full amount yourself? We list the best prop firms on evaluation fees, profit targets, drawdown limits, permitted trading strategies and payout conditions. Understand what you need to do to qualify, keep the account and actually withdraw your profits.
Side by Side rules, payouts and splits.
Compare two funded trading programmes by drawdown, consistency rules, trading restrictions, reset fees and payout eligibility to see which terms fit the way you trade.