 Skip to content
Features
RizeTrade Features
Import your trades, journal your decisions, track your behaviour and analyse your performance with RizeTrade.
- 01Broker Sync or File Import
- 02Enter Trades Manually
- 03View Past Trades on a Chart
- 04Journal
- 05Track Emotions
- 06Trade Grade
- 07Discipline Tracker
- 08P&L Calendar
- 09Statistics
- 10Reports
- 11Trading Efficiency
- 12Trading Mentor AI
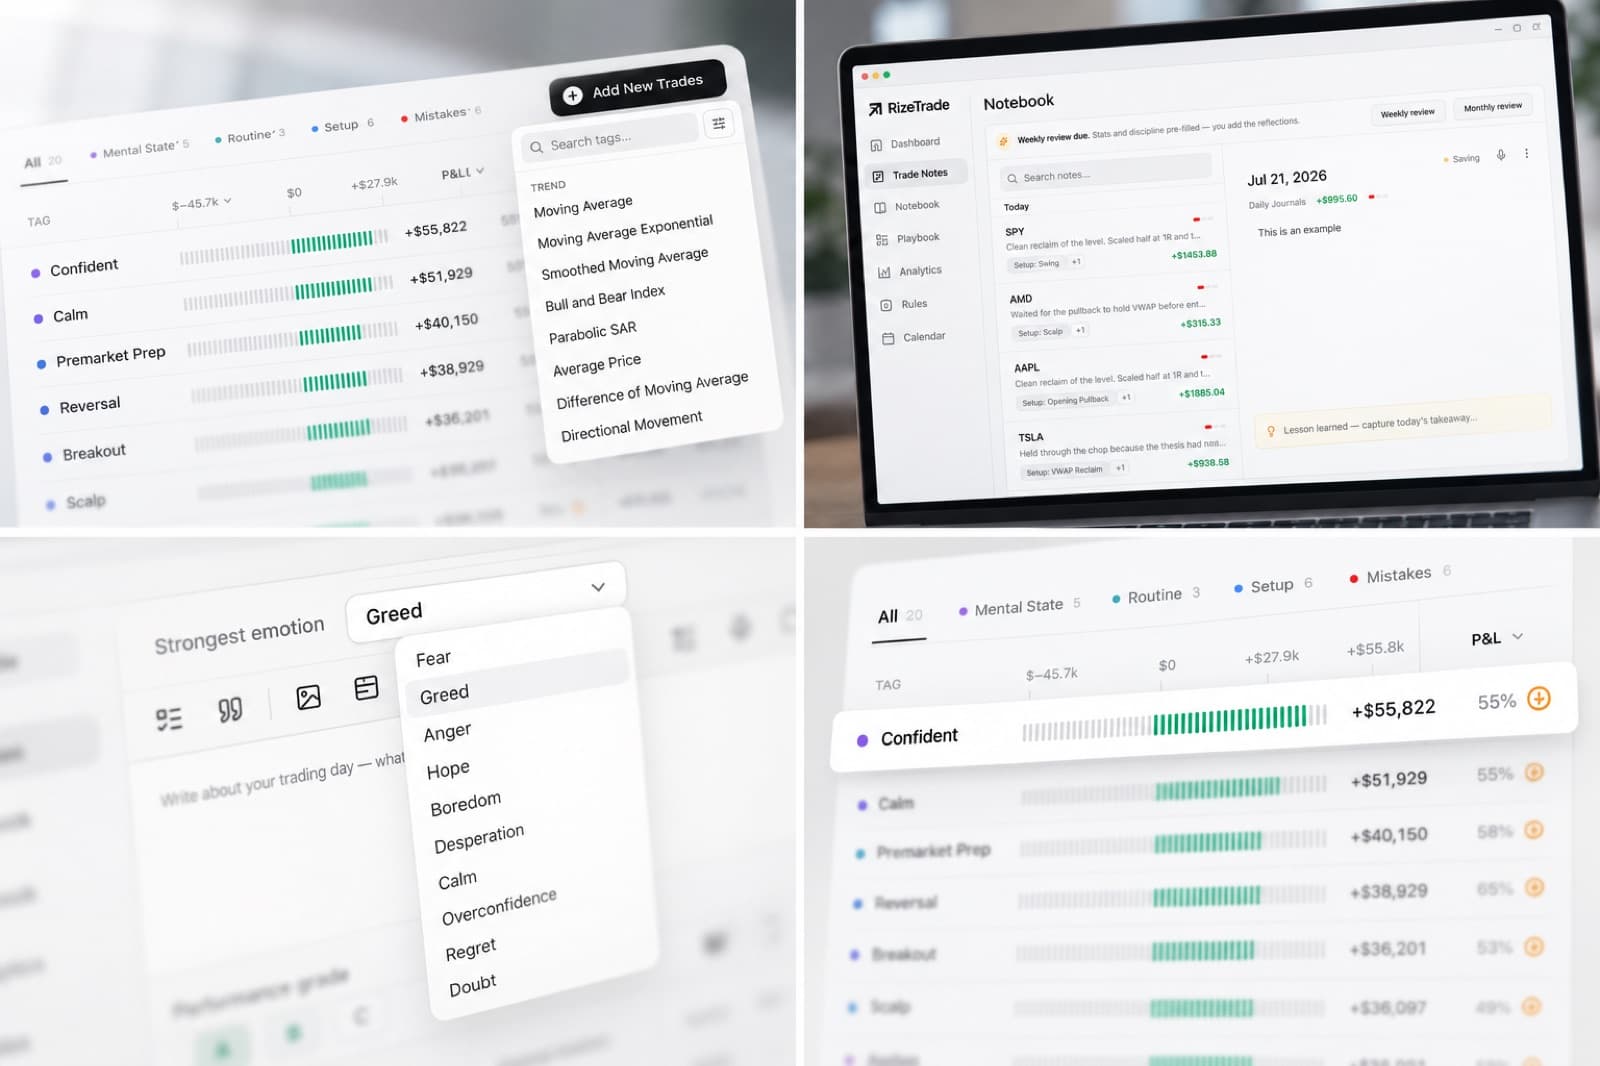








01Broker Sync or File Import
Import your trades automatically or from a file
Connect your broker to automatically sync your trades with RizeTrade.
If your broker is not connected, you can upload your trading history using a supported file format instead.
Once imported, your trades are available across your journal, charts, statistics and reports.
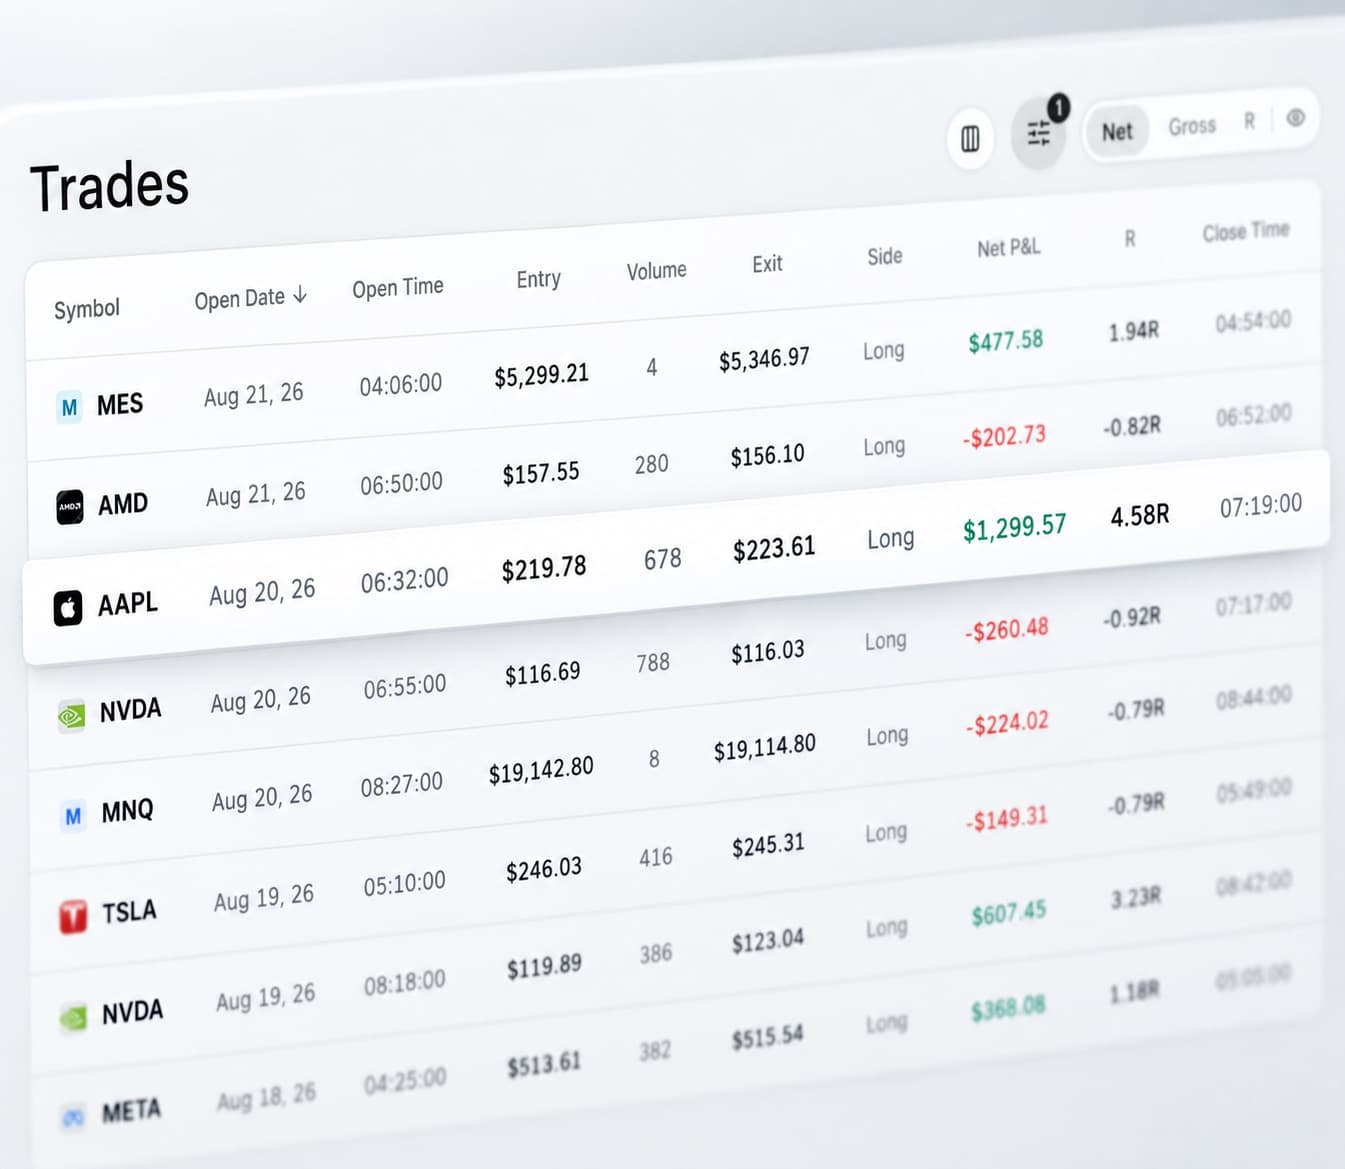
02Enter Trades Manually
Add trades manually to your journal
Create a trade manually by entering the trade details yourself.
Use manual entry for trades from unsupported brokers, accounts you do not want to connect, or any trade you want to record yourself.
Your manually entered trades are analysed alongside the rest of your trading history.
03View Past Trades on a Chart
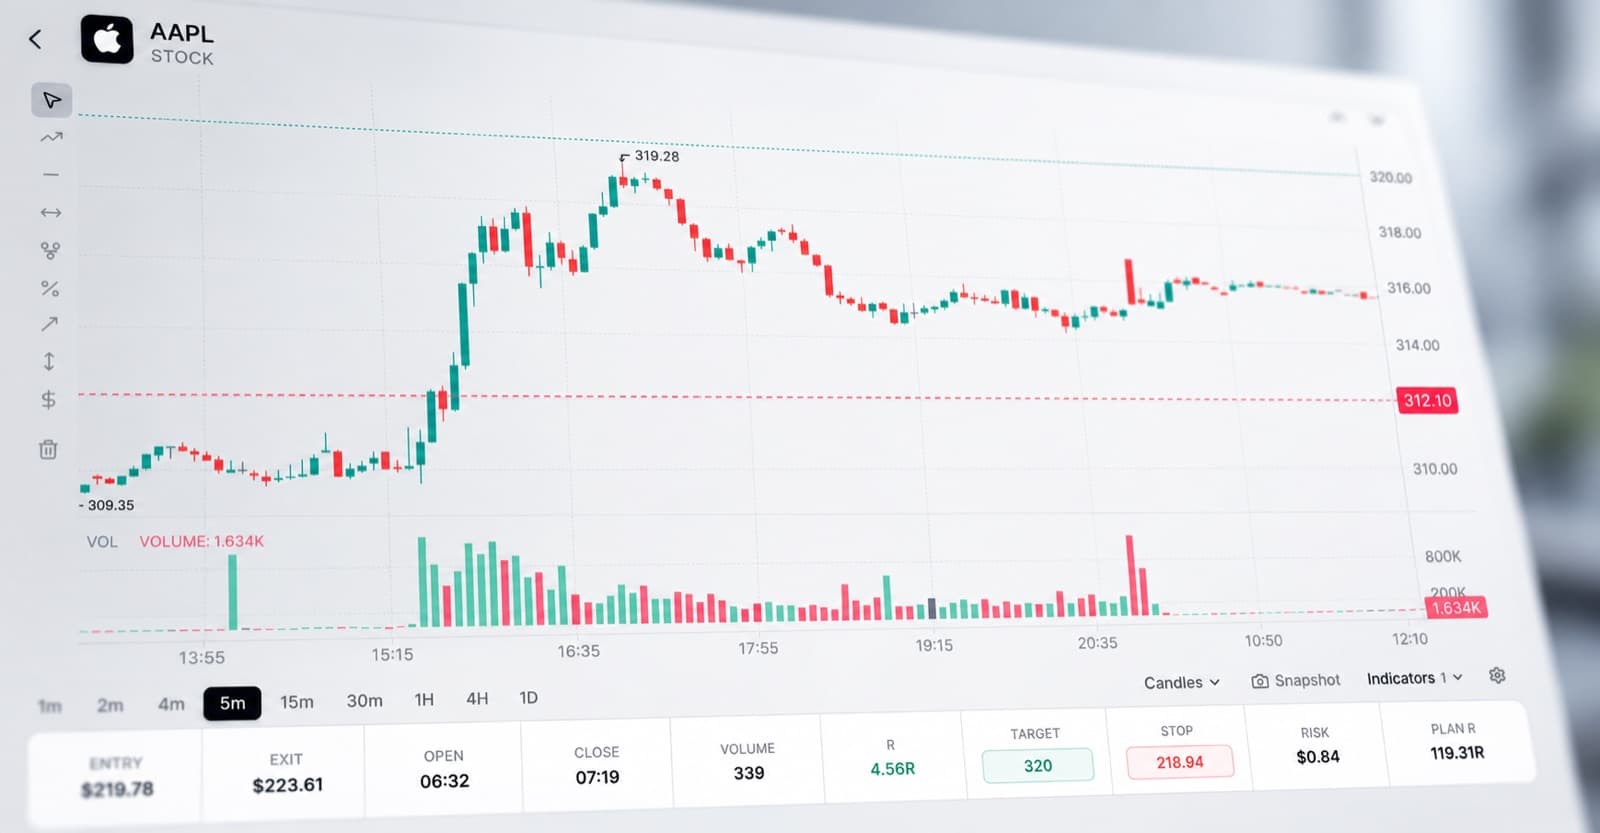
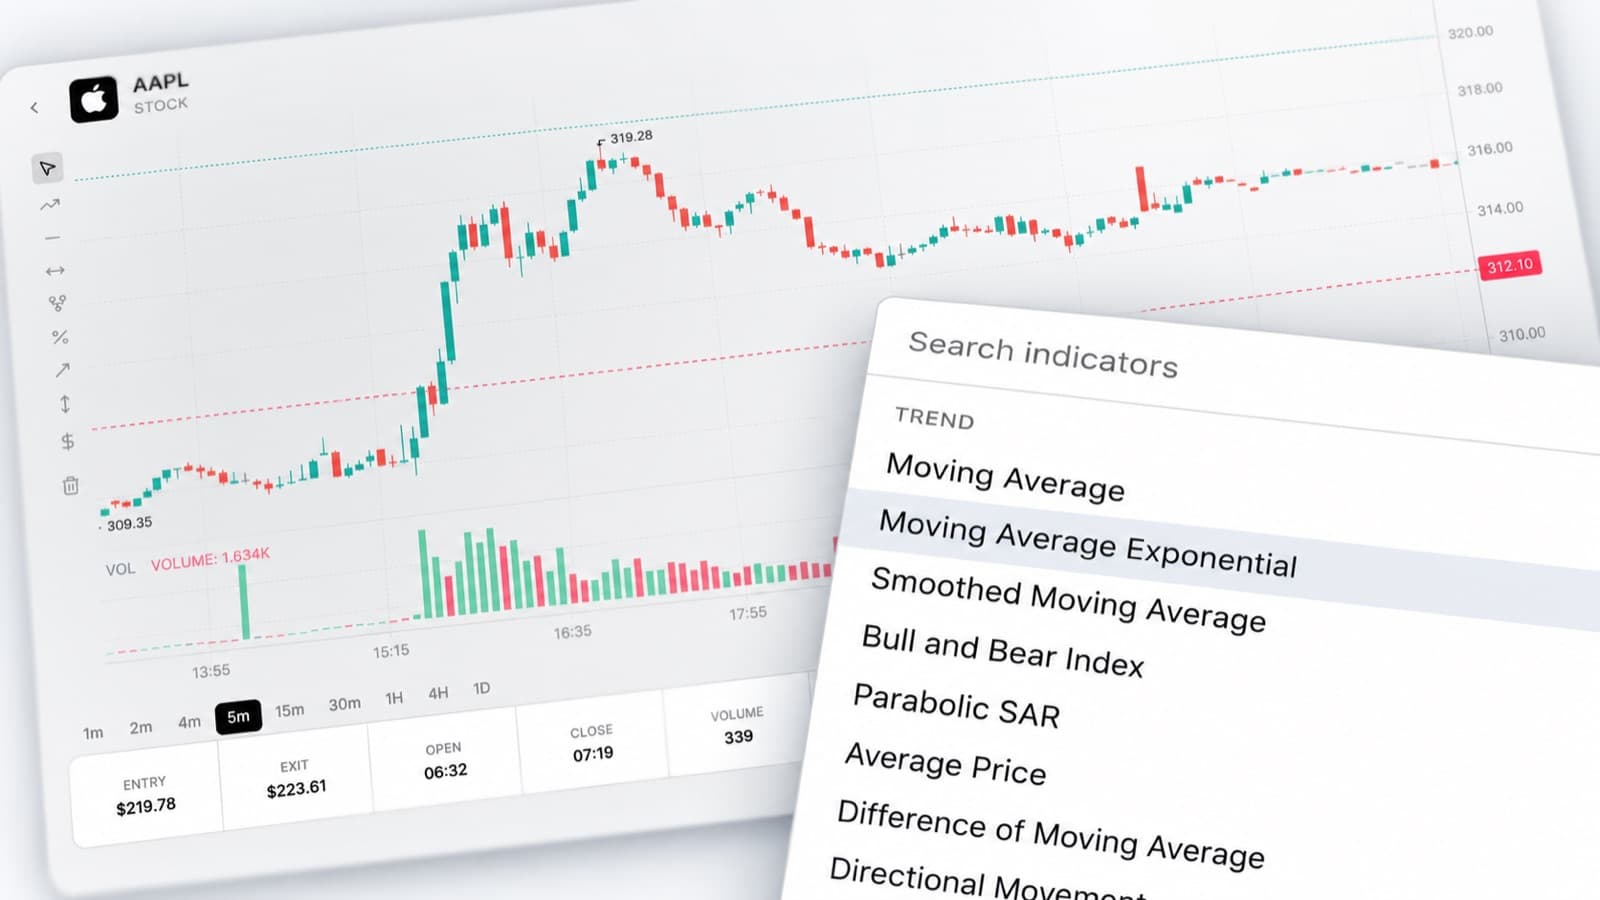
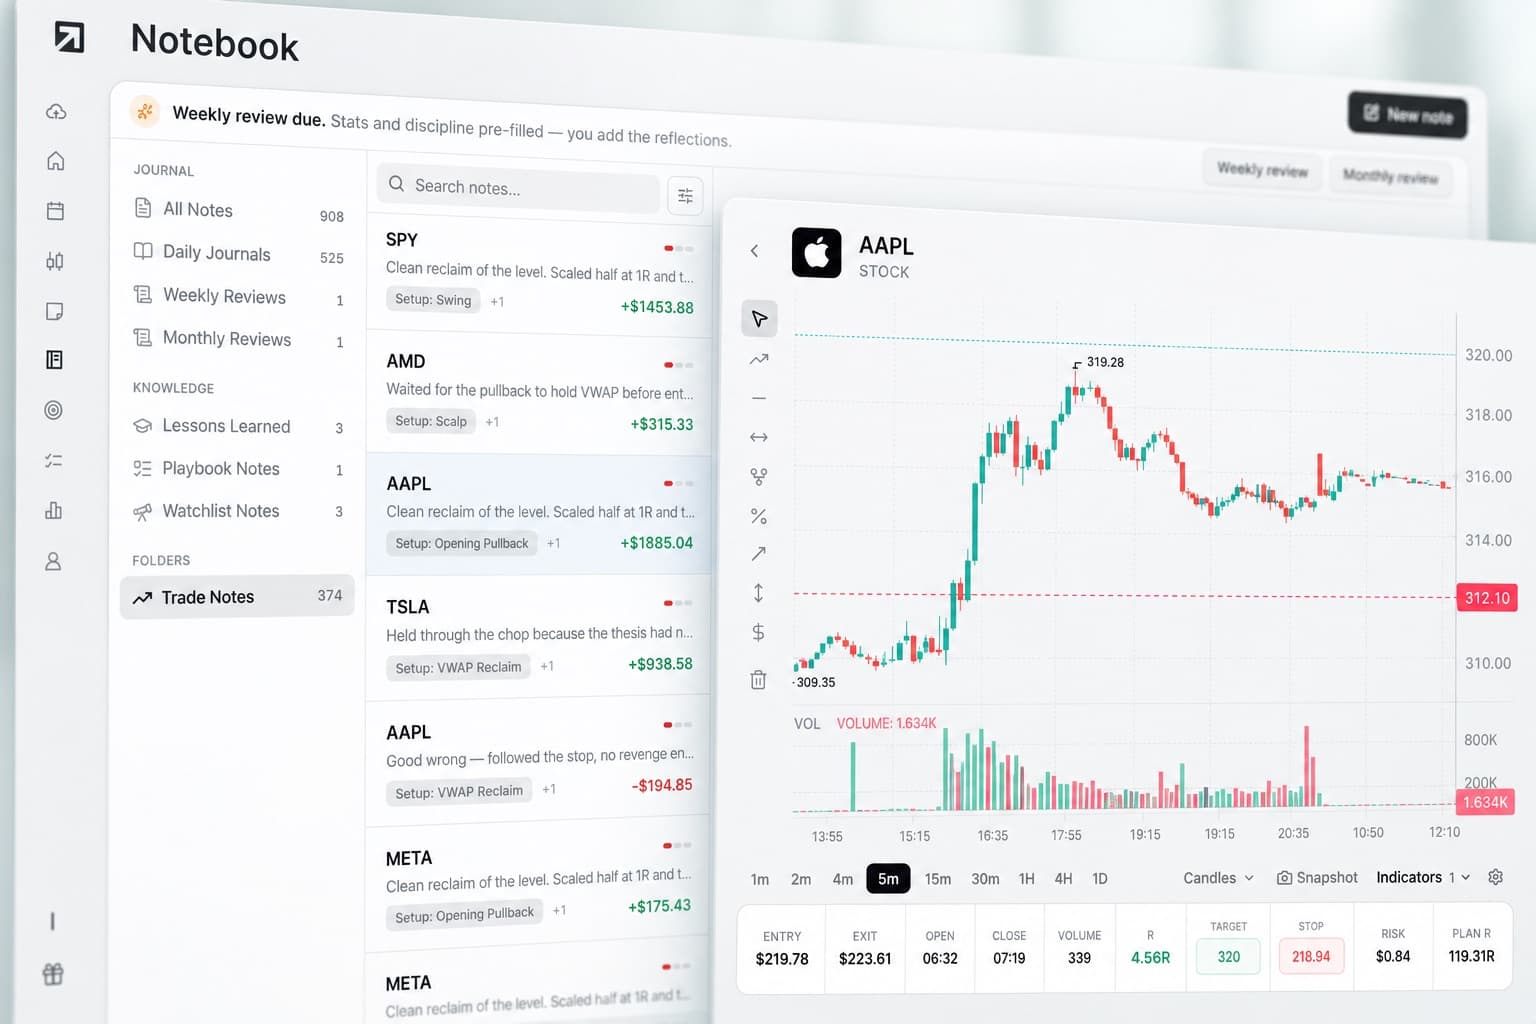
Review your entries and exits directly on the chart
Open a completed trade and view it against the historical price chart.
See where you entered and exited so you can review how the trade developed after your execution.
This gives you more context than reviewing entry and exit prices alone.
04Journal
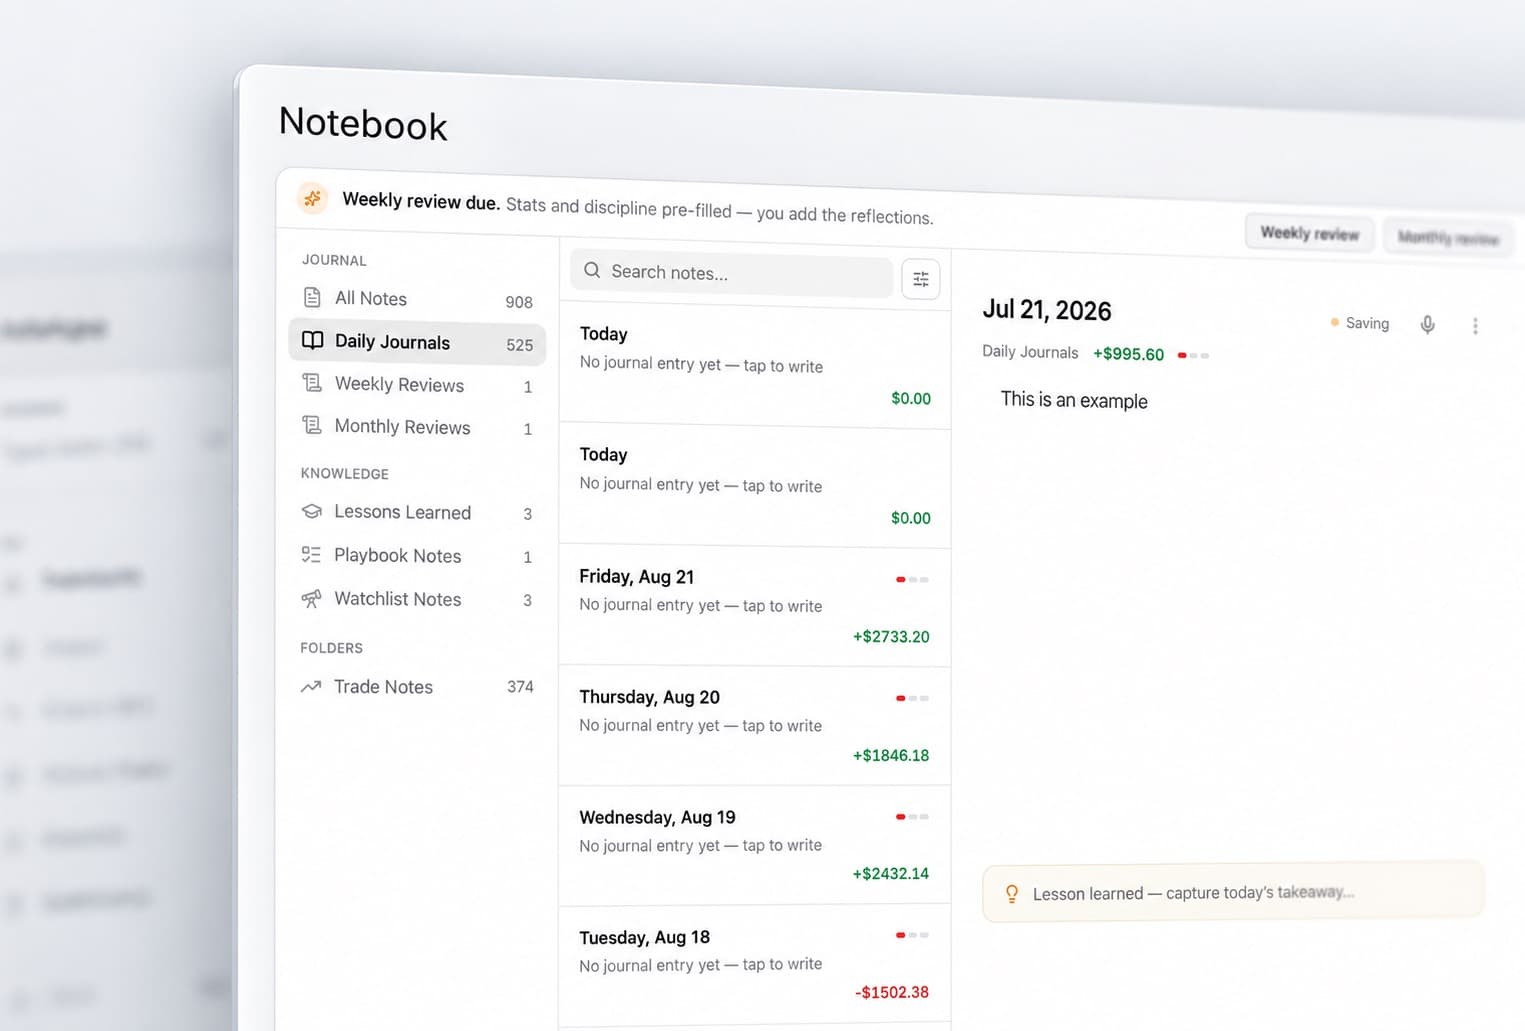
Add notes to your trades
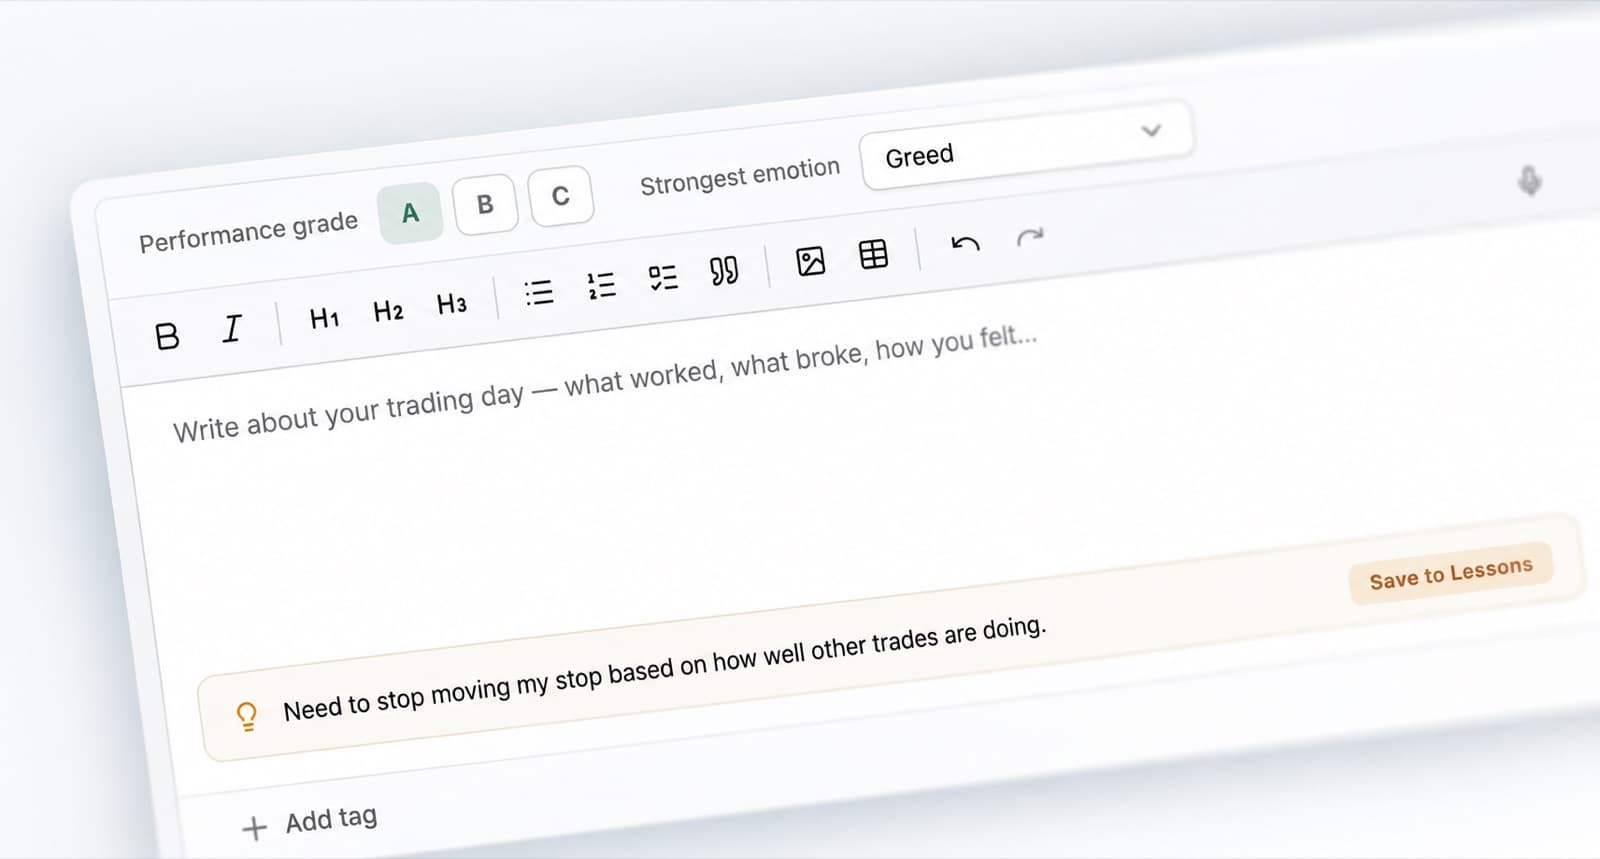
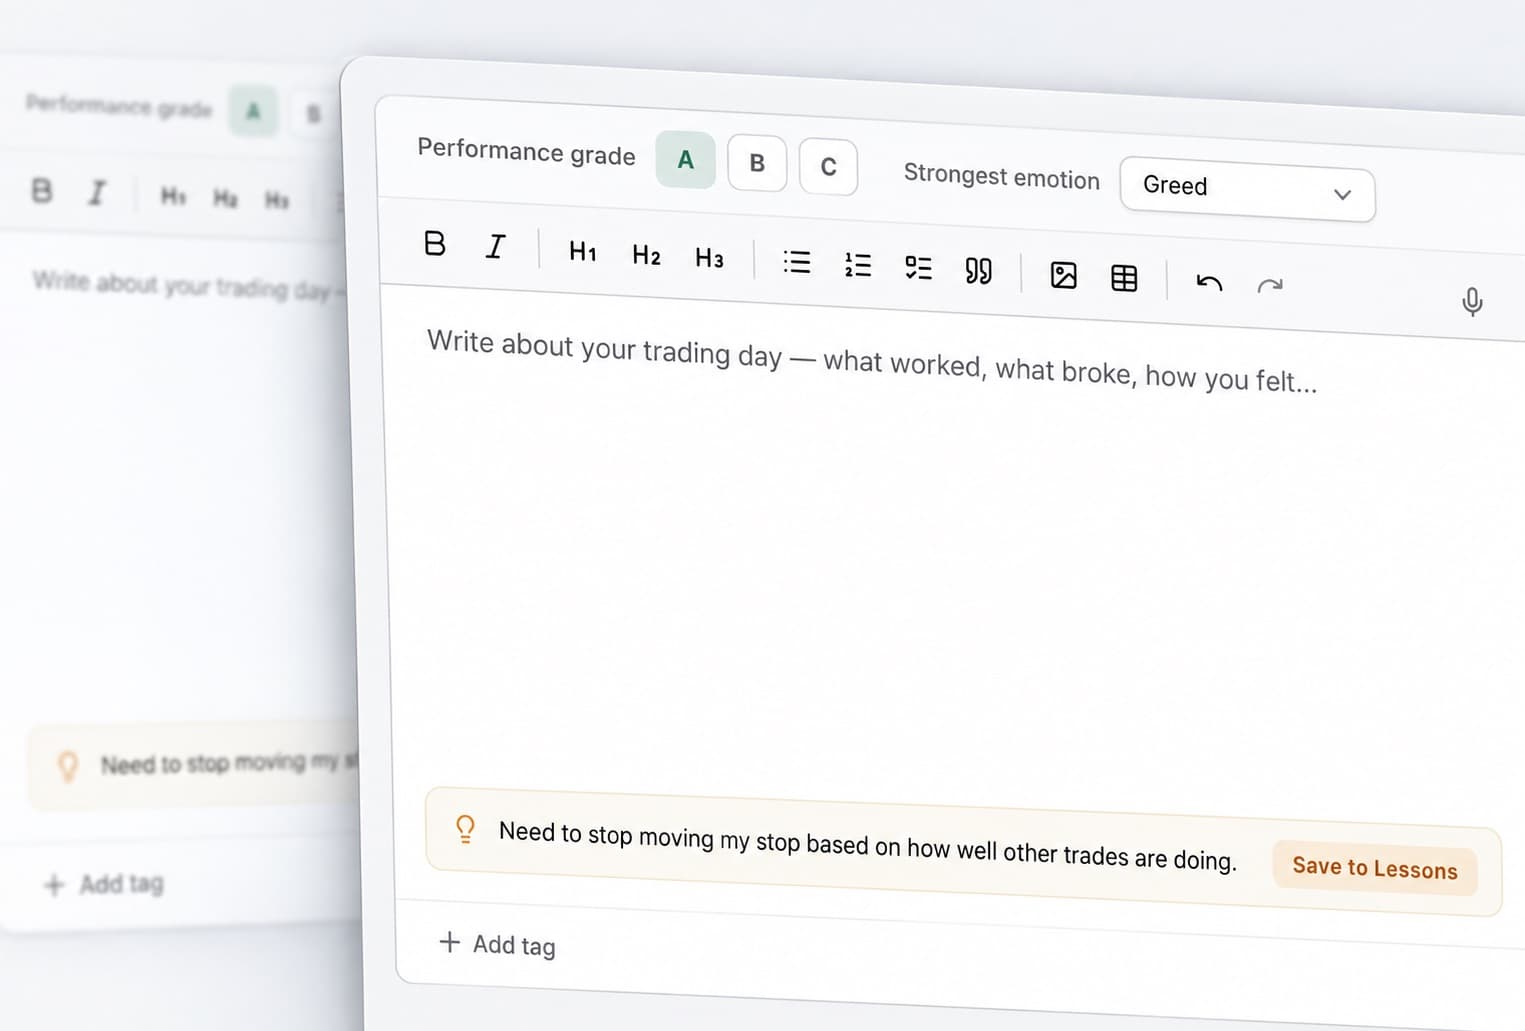
Write journal entries for your trades and record the information you want to remember.
Document your trade idea, setup, execution, mistakes, lessons or anything else that influenced the trade.
Return to your notes later when reviewing your trading history.
05Track Emotions
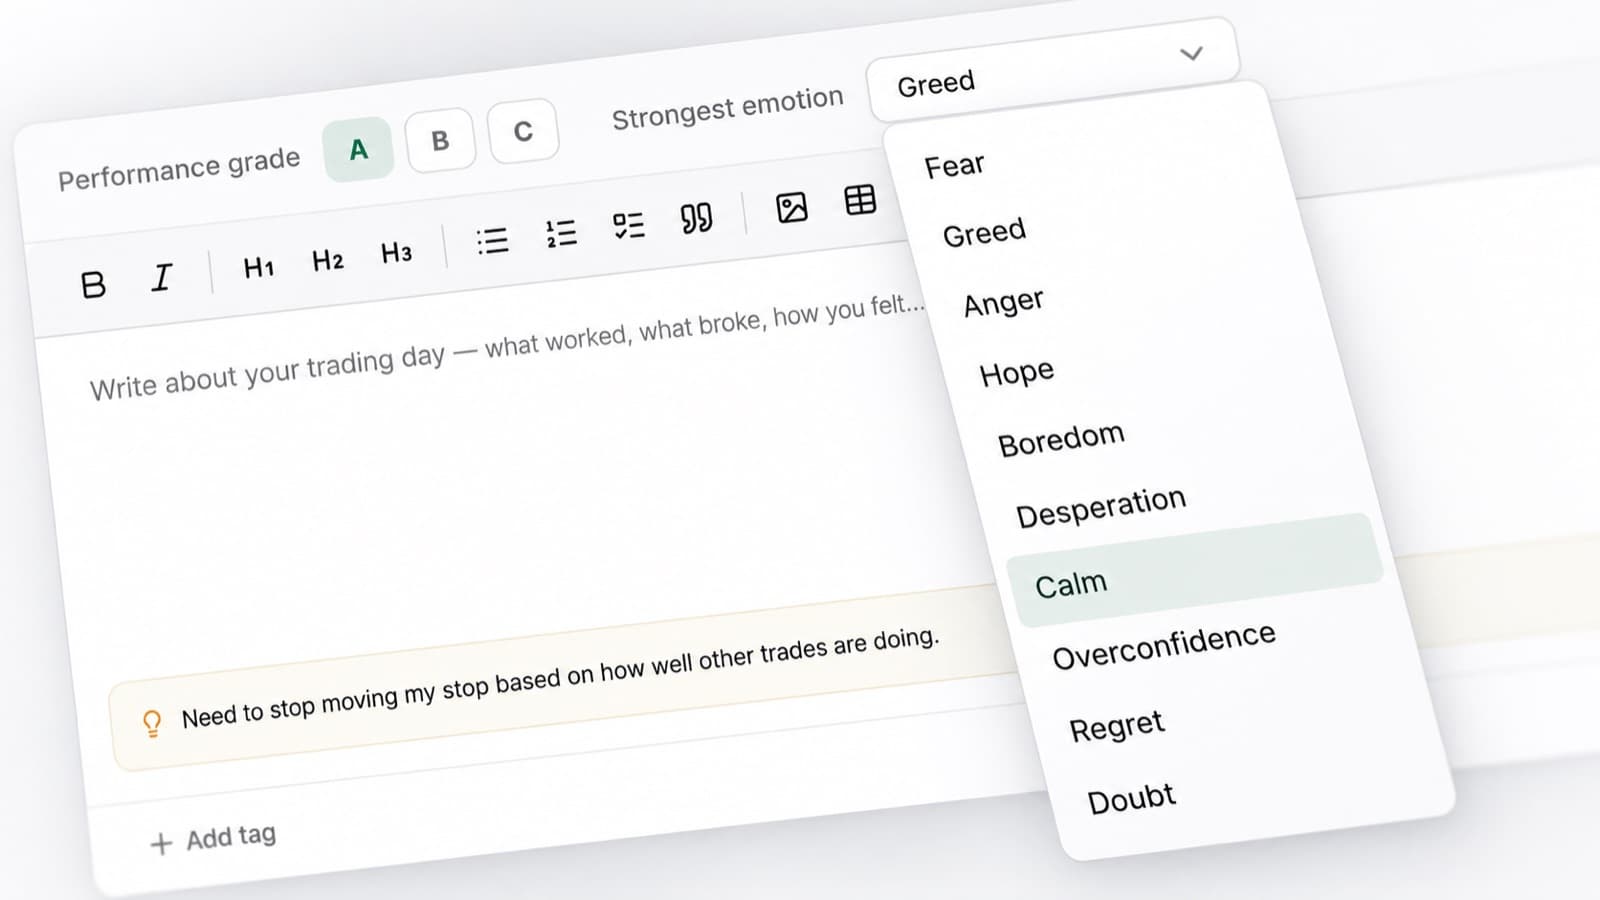
Record how you felt during your trades
Track the emotions associated with individual trades.
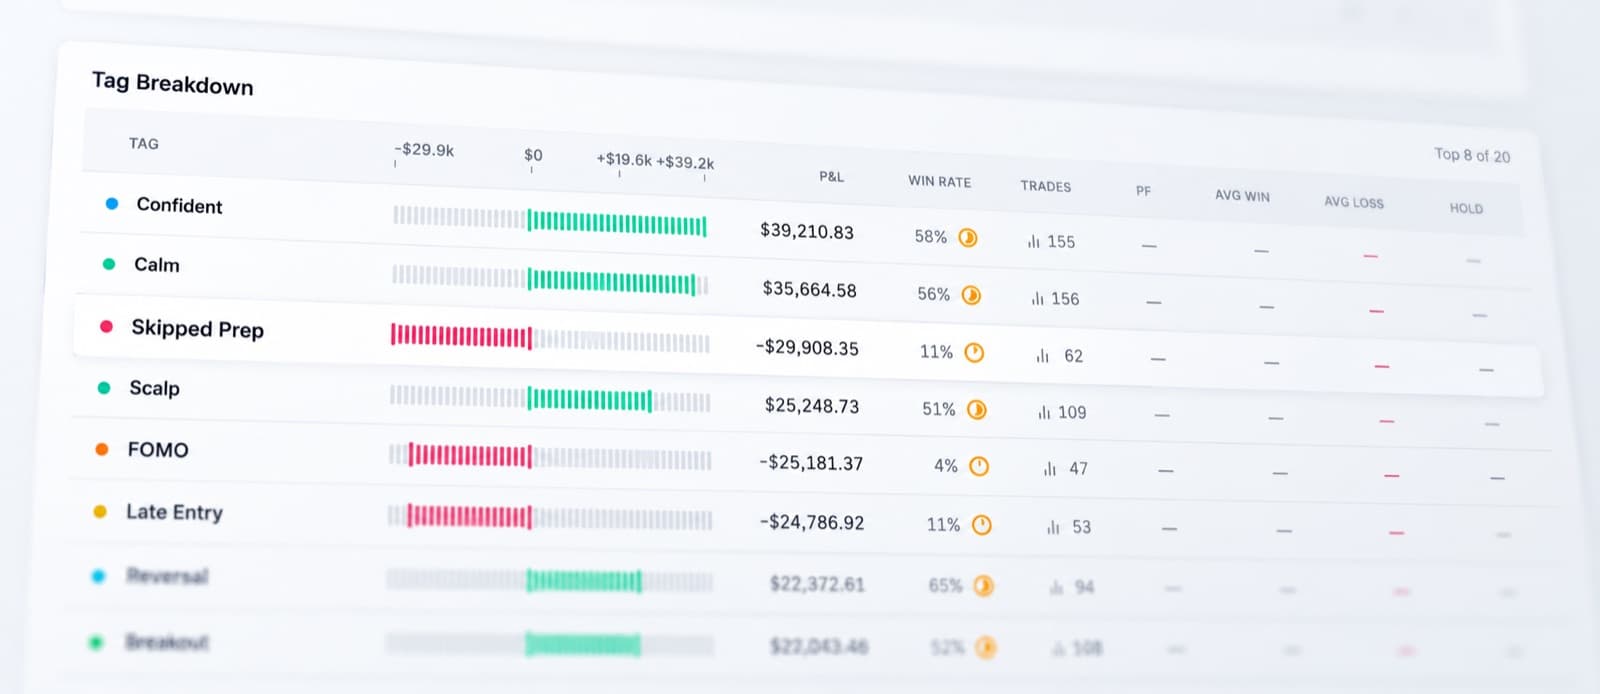
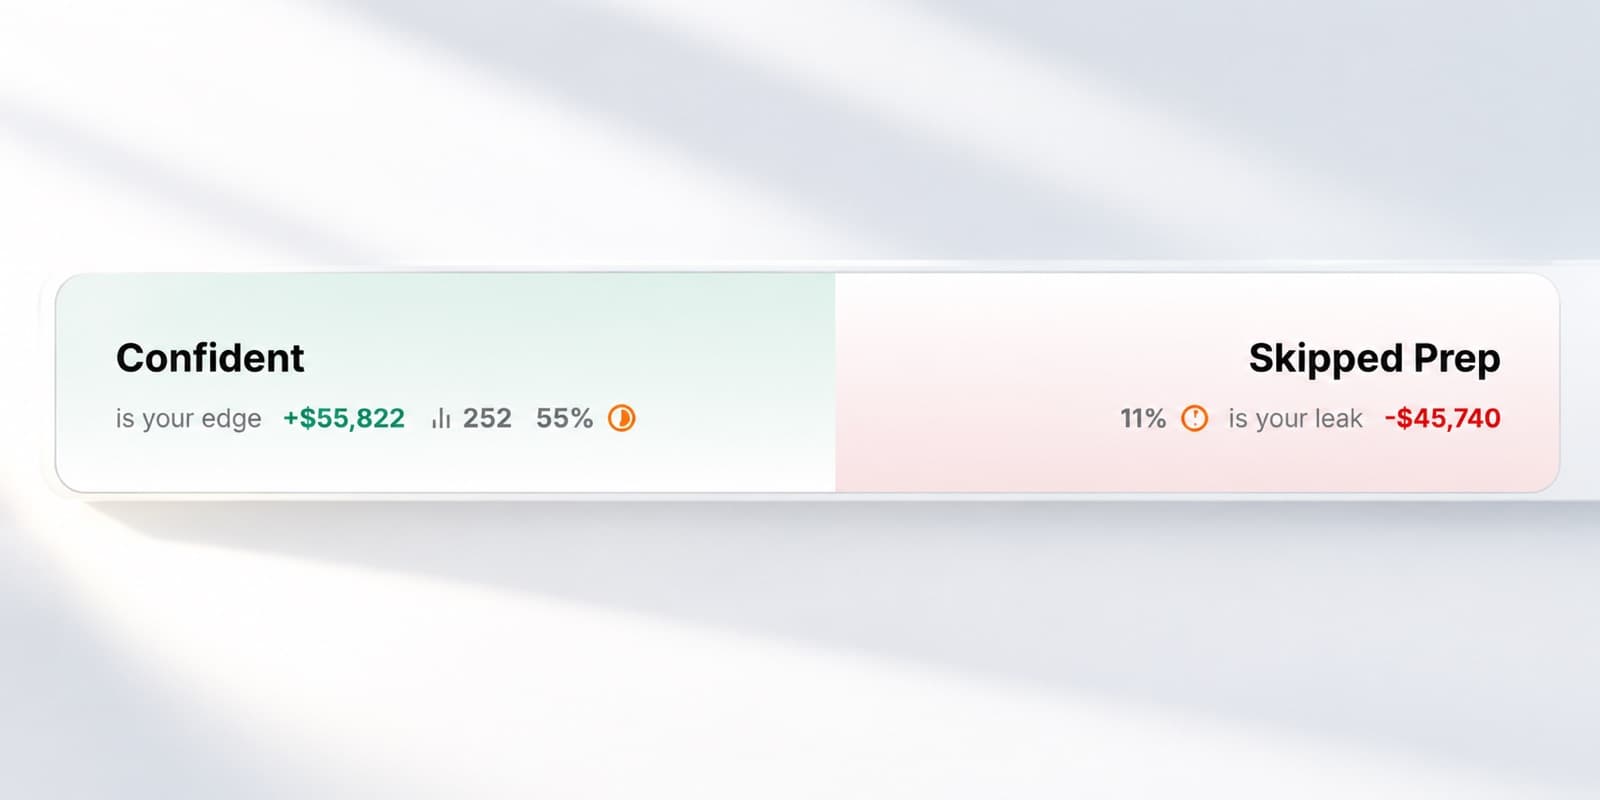
Record emotions such as confidence, fear, frustration or FOMO, then review how different emotional states relate to your trading performance.
This helps you identify emotional patterns that may be affecting your decisions.
06Trade Grade
Give each trade a grade
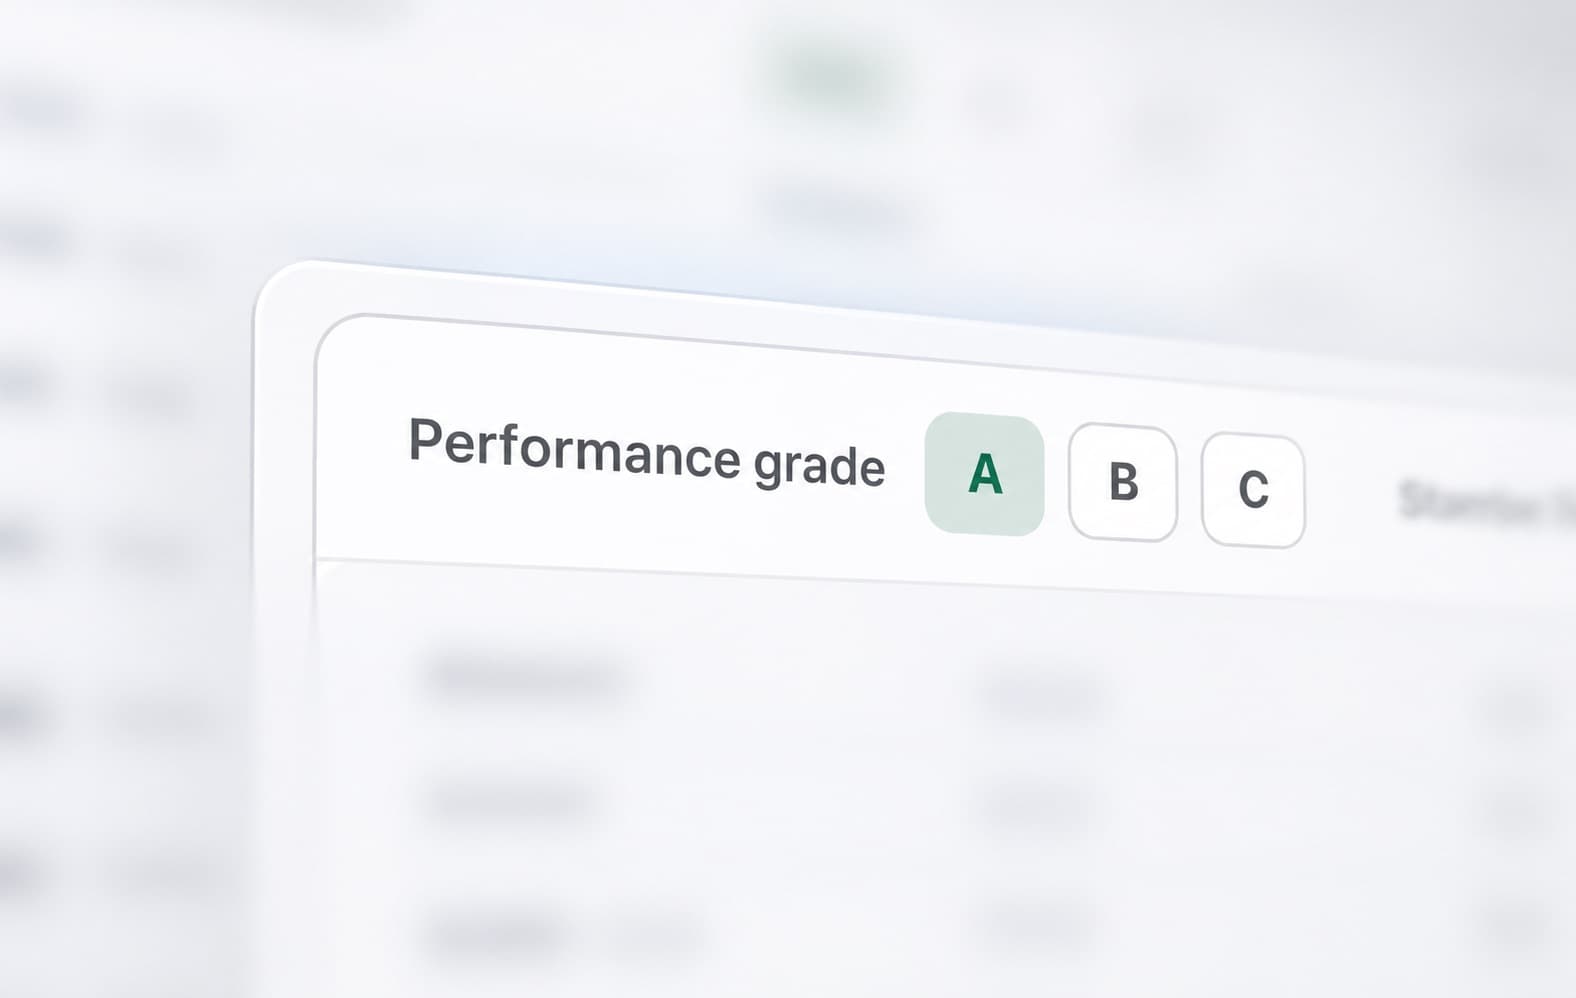
Grade your trades based on the quality of your execution.
Instead of judging a trade only by whether it made or lost money, use Trade Grade to record how well you followed your intended process.
Over time, you can compare your trade quality with your actual results.
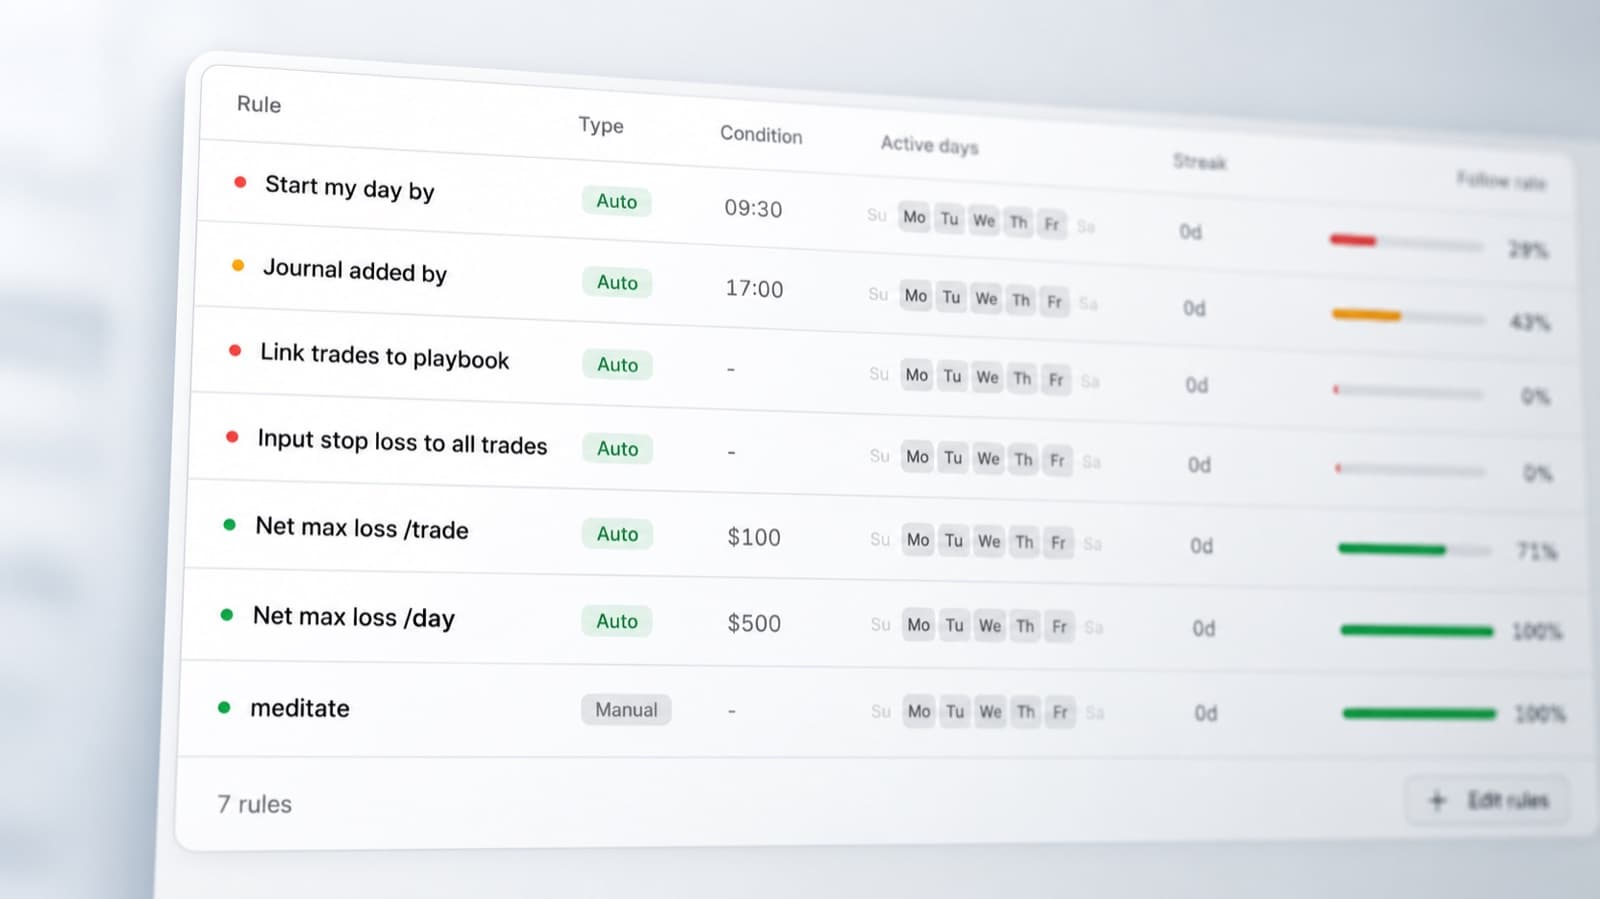
07Discipline Tracker
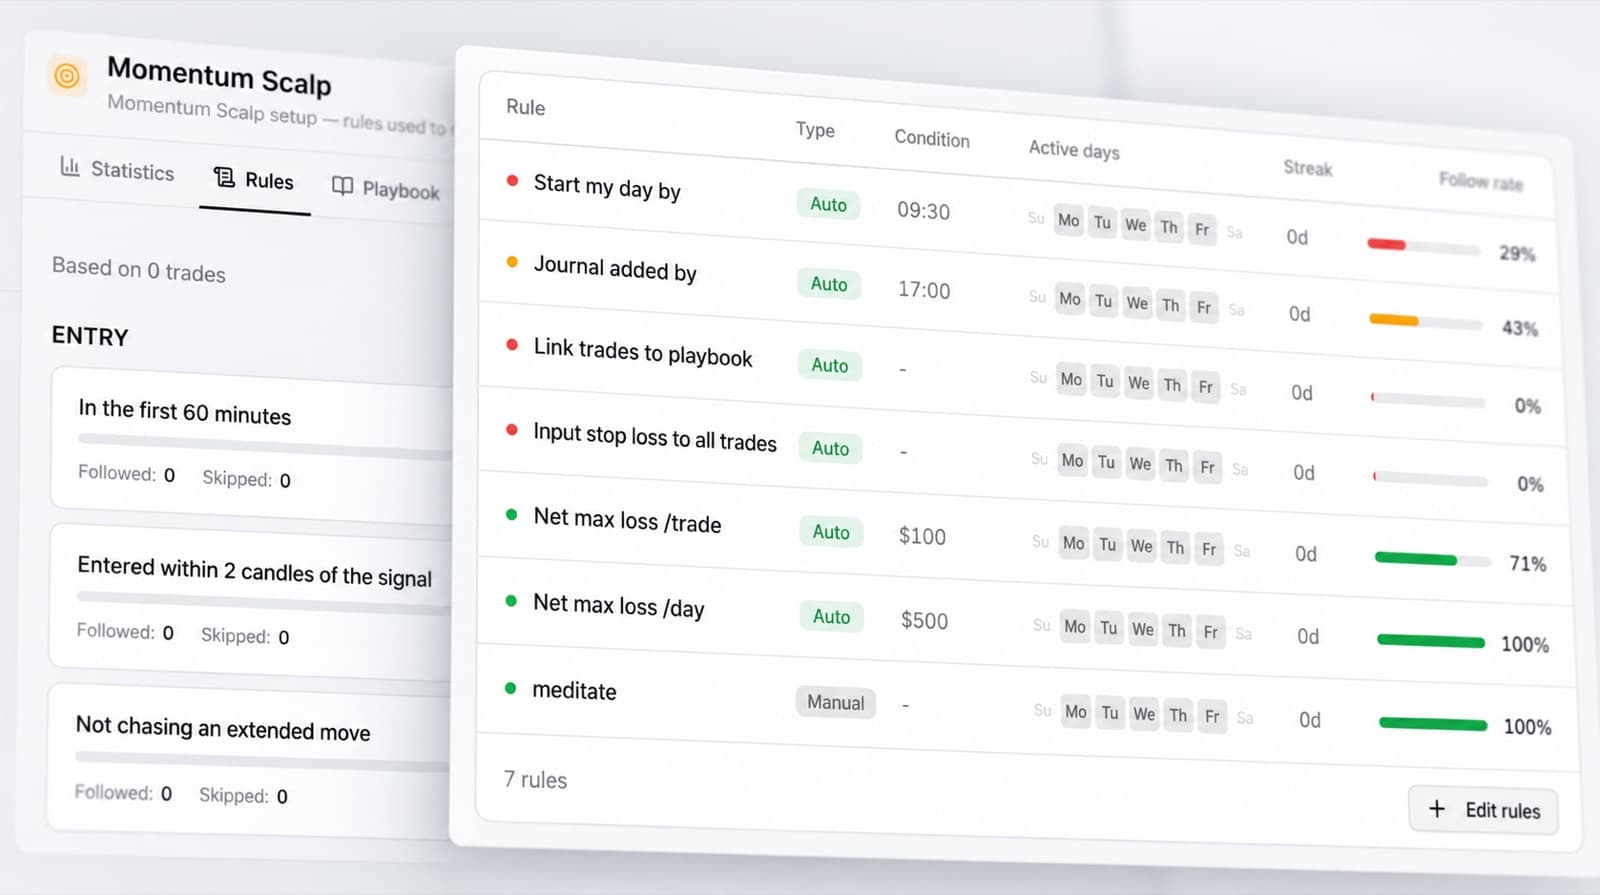
Track whether you followed your trading rules
Use the Discipline Tracker to record how well you followed your trading plan.
Review disciplined trades alongside trades where you broke your rules and identify behaviours that repeatedly affect your results.
This gives you a clearer way to measure trading discipline over time.
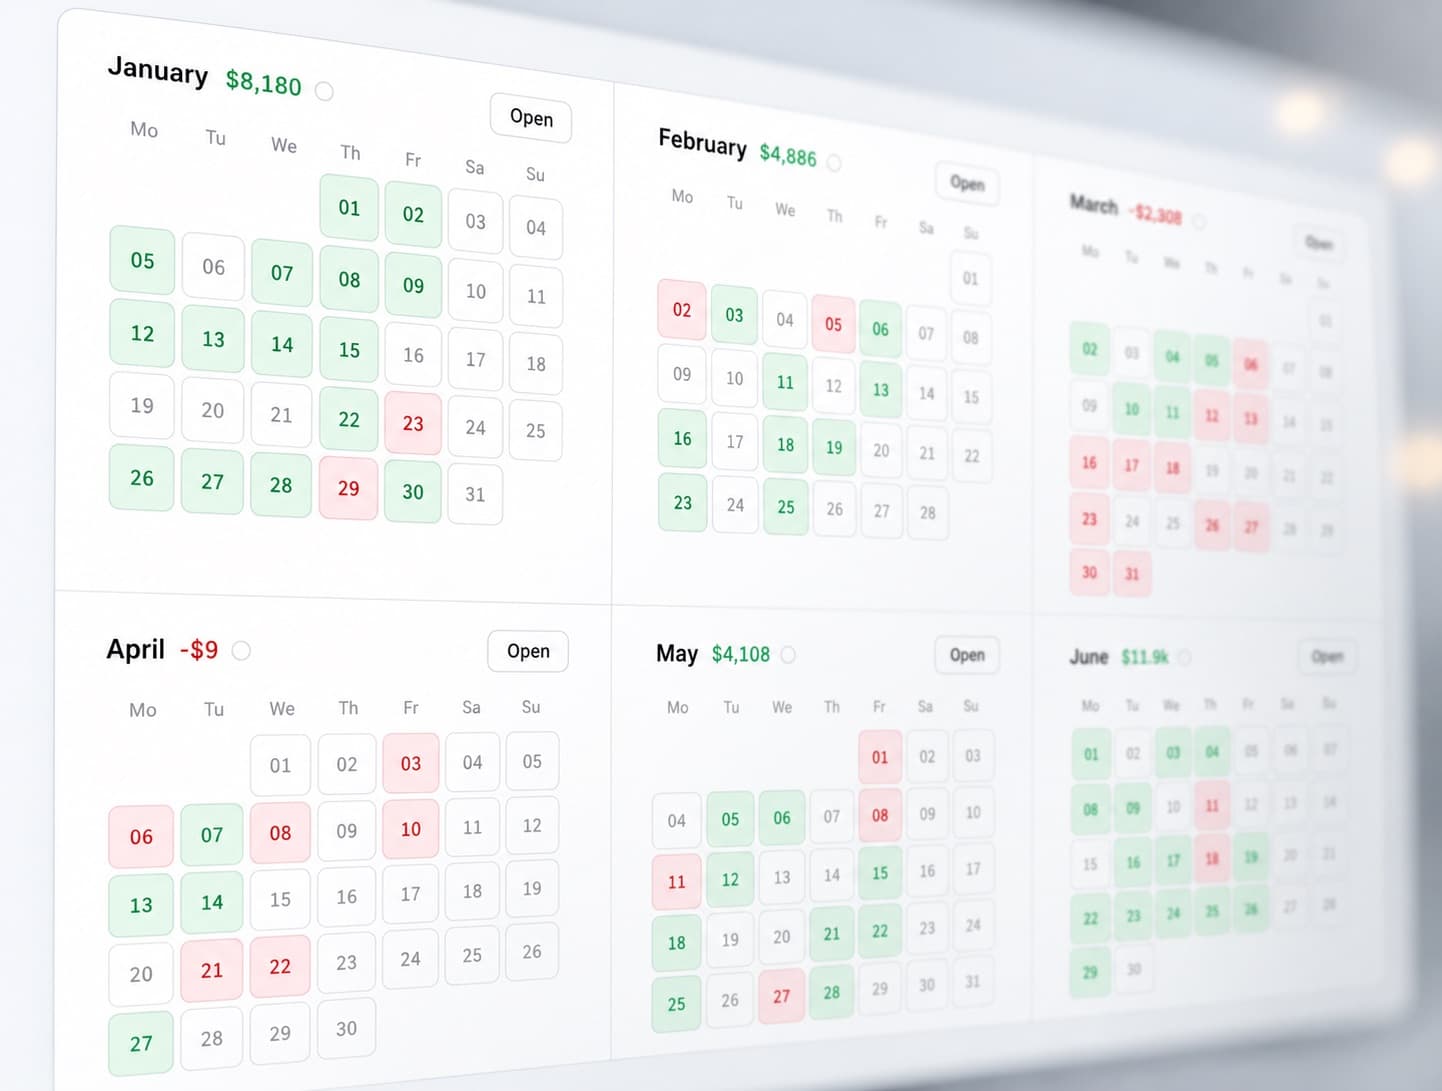
08P&L Calendar
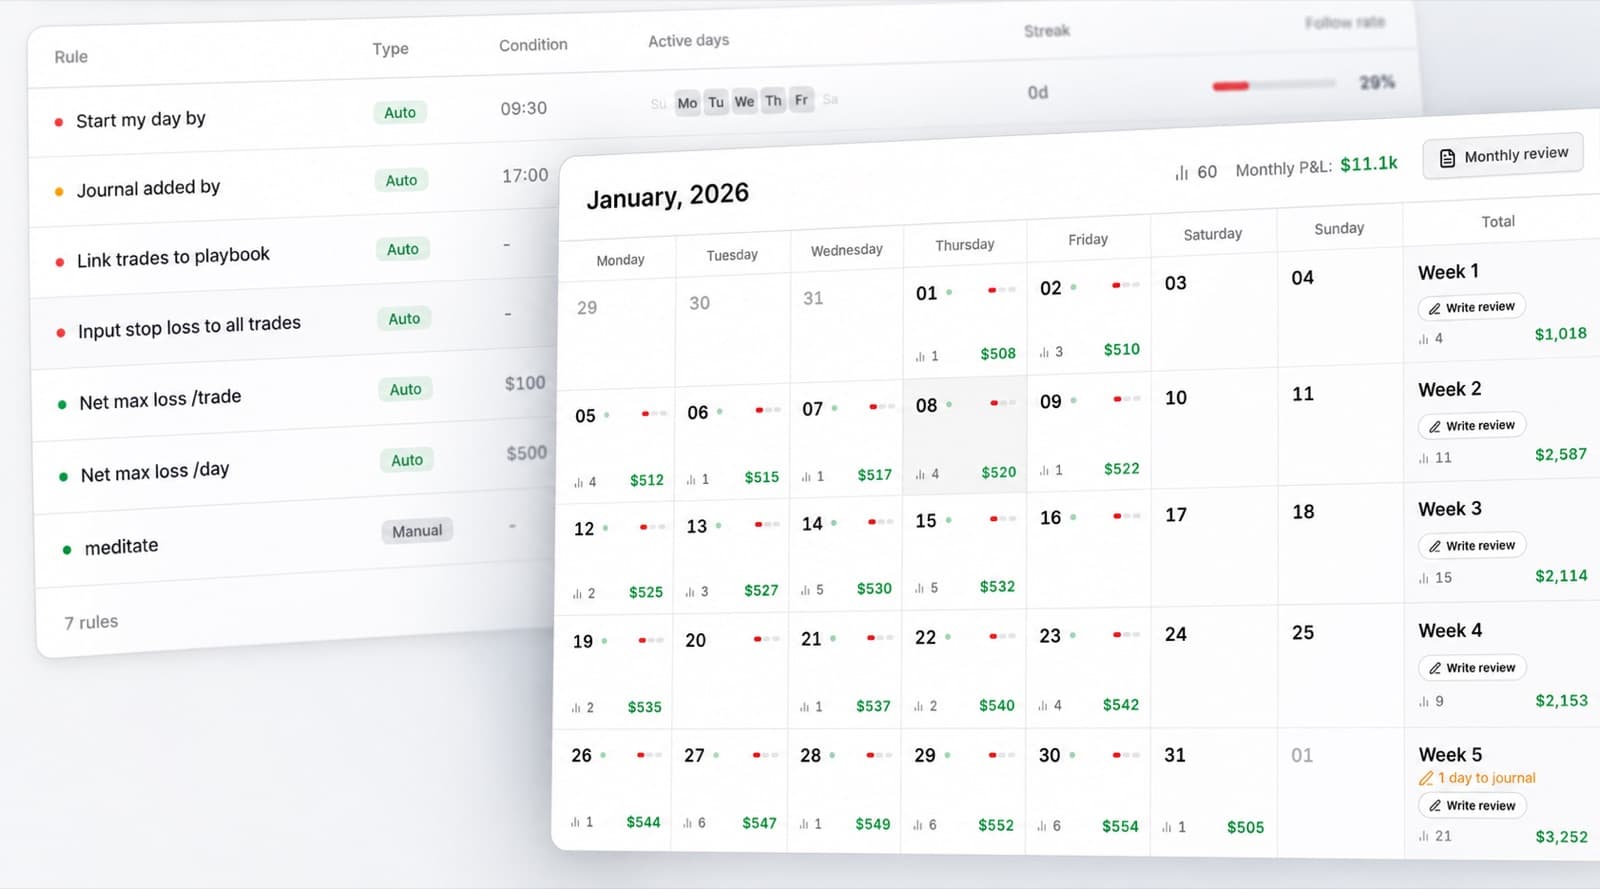
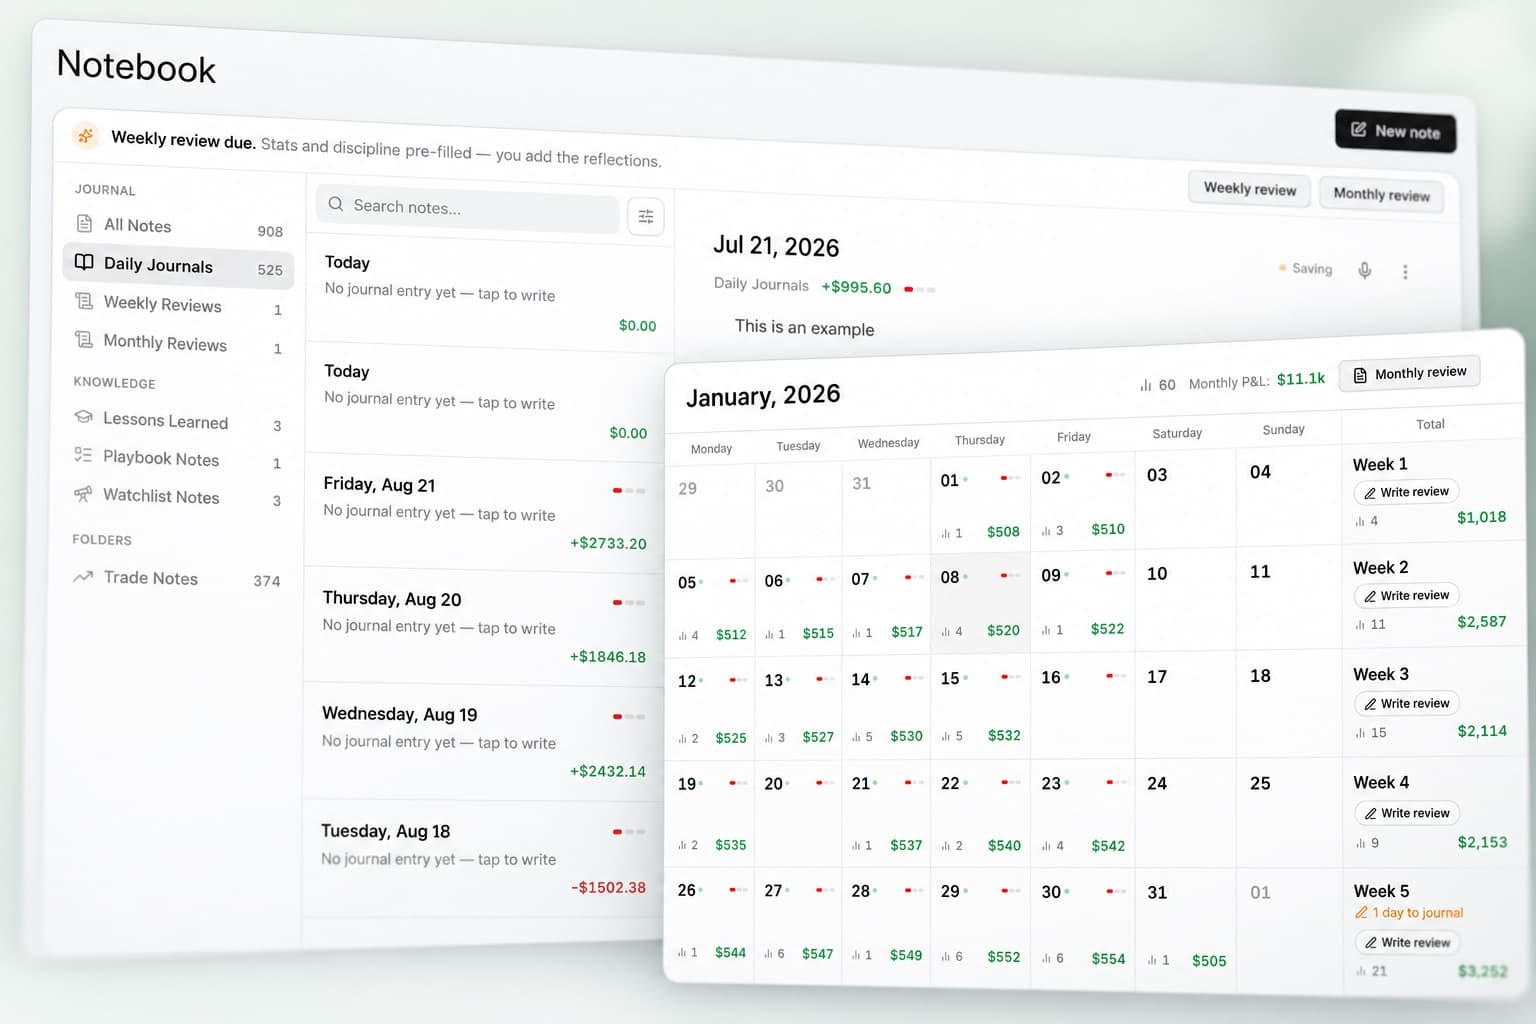
View your daily P&L on a calendar
See your trading results organised by day in the P&L Calendar.
Quickly review profitable and losing days, trading streaks and your performance across each month.
Use the calendar to get a simple visual overview of your trading activity and results.
09Statistics
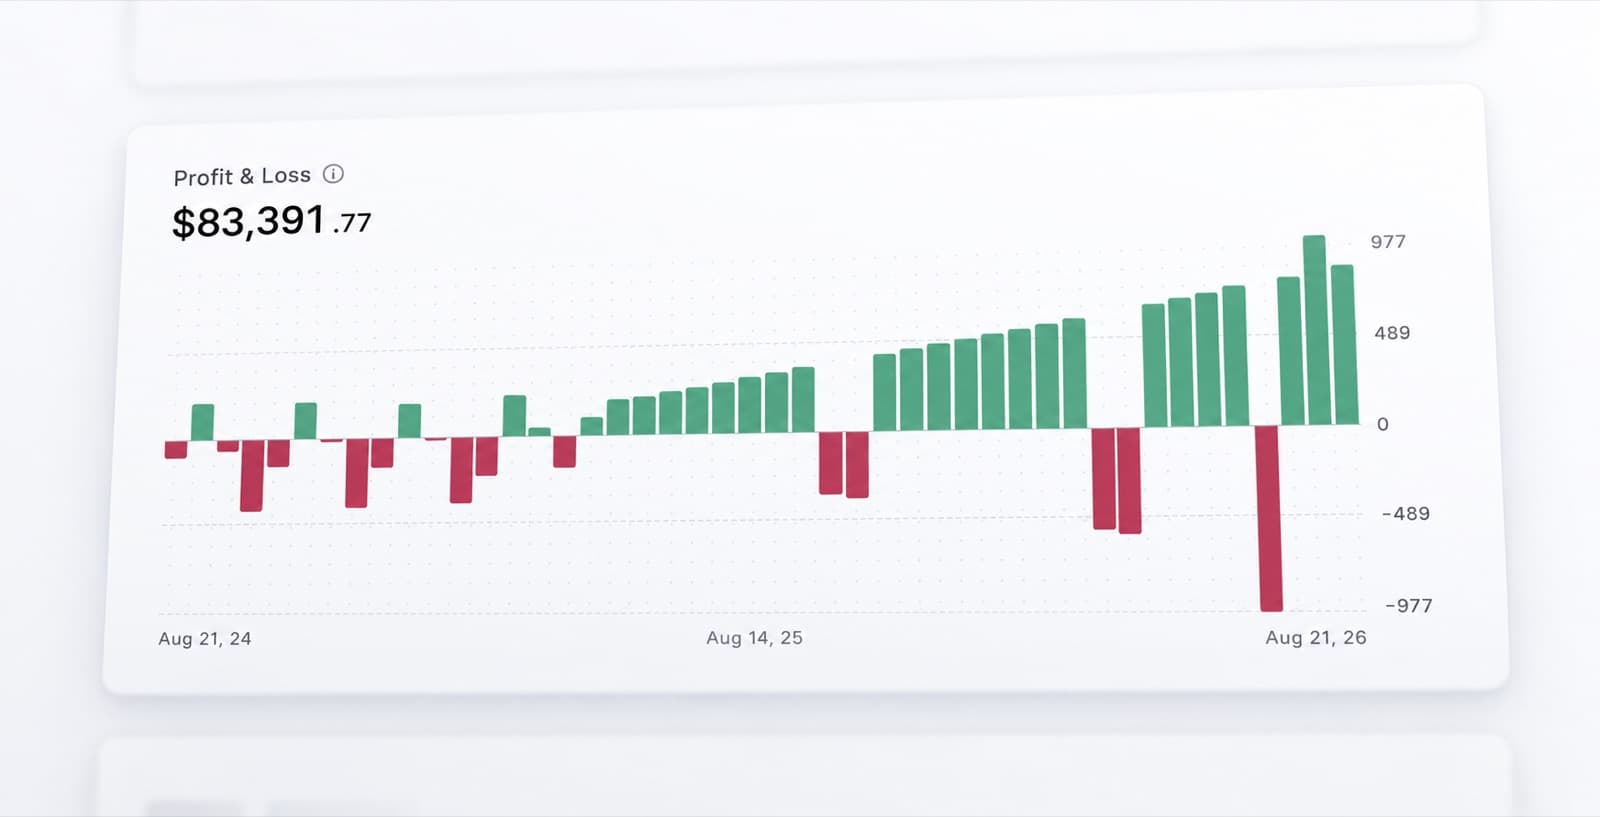
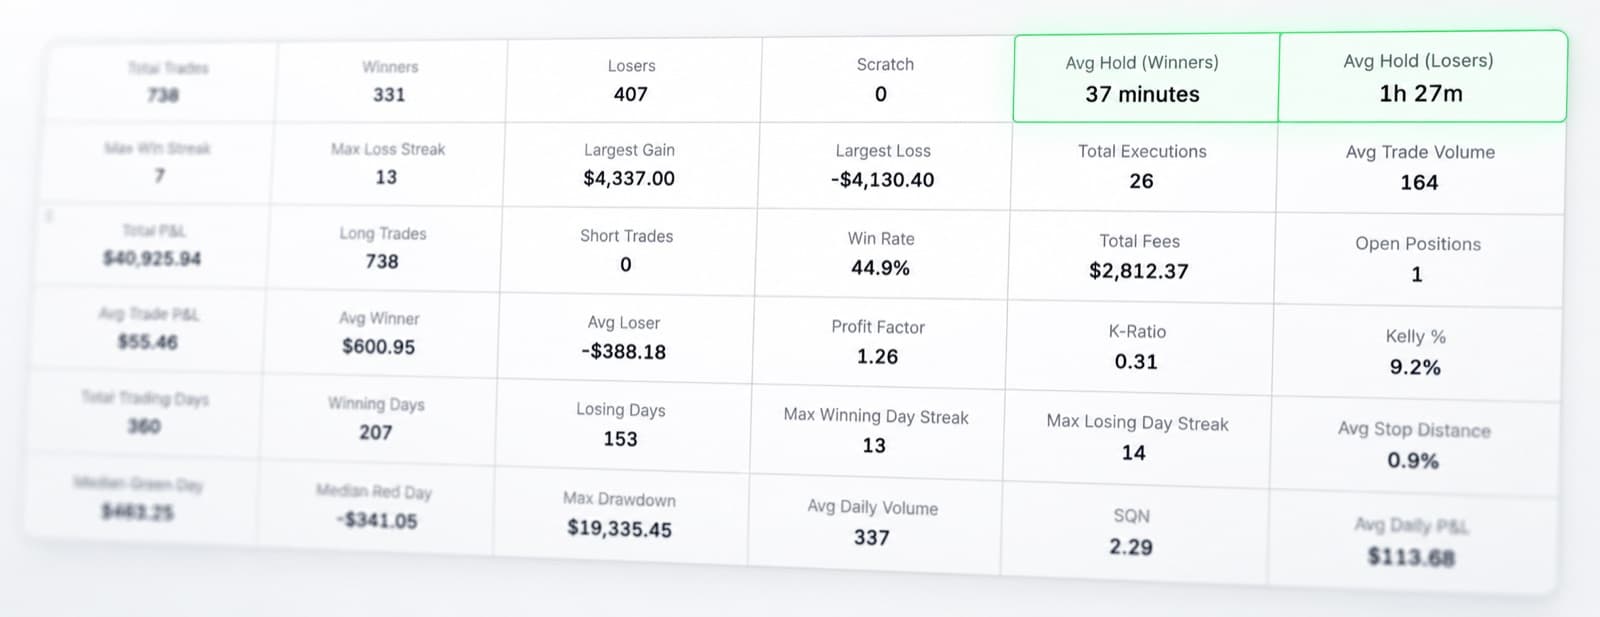
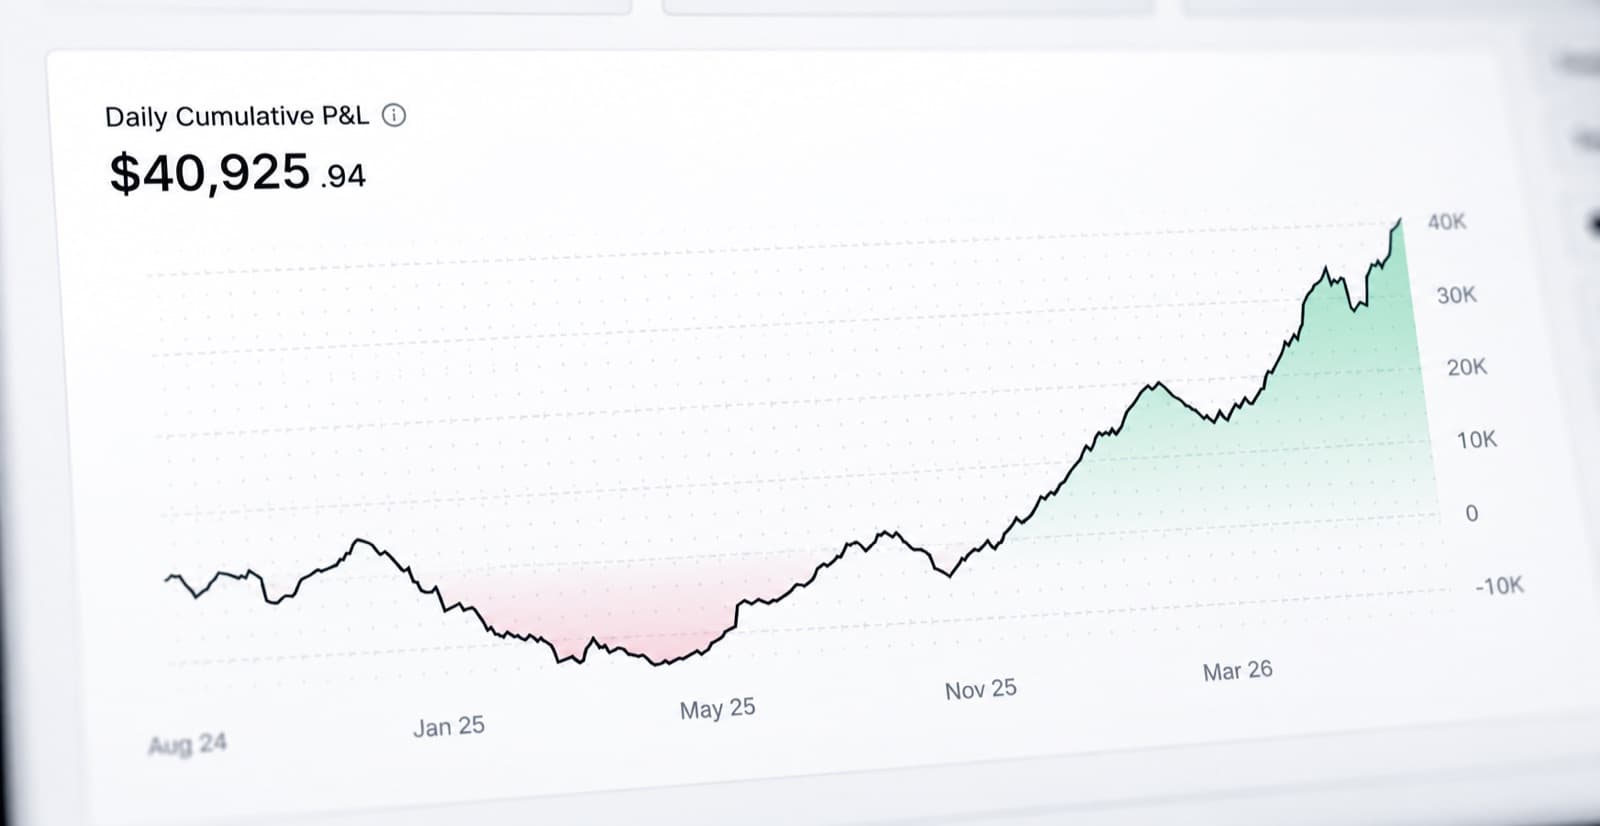
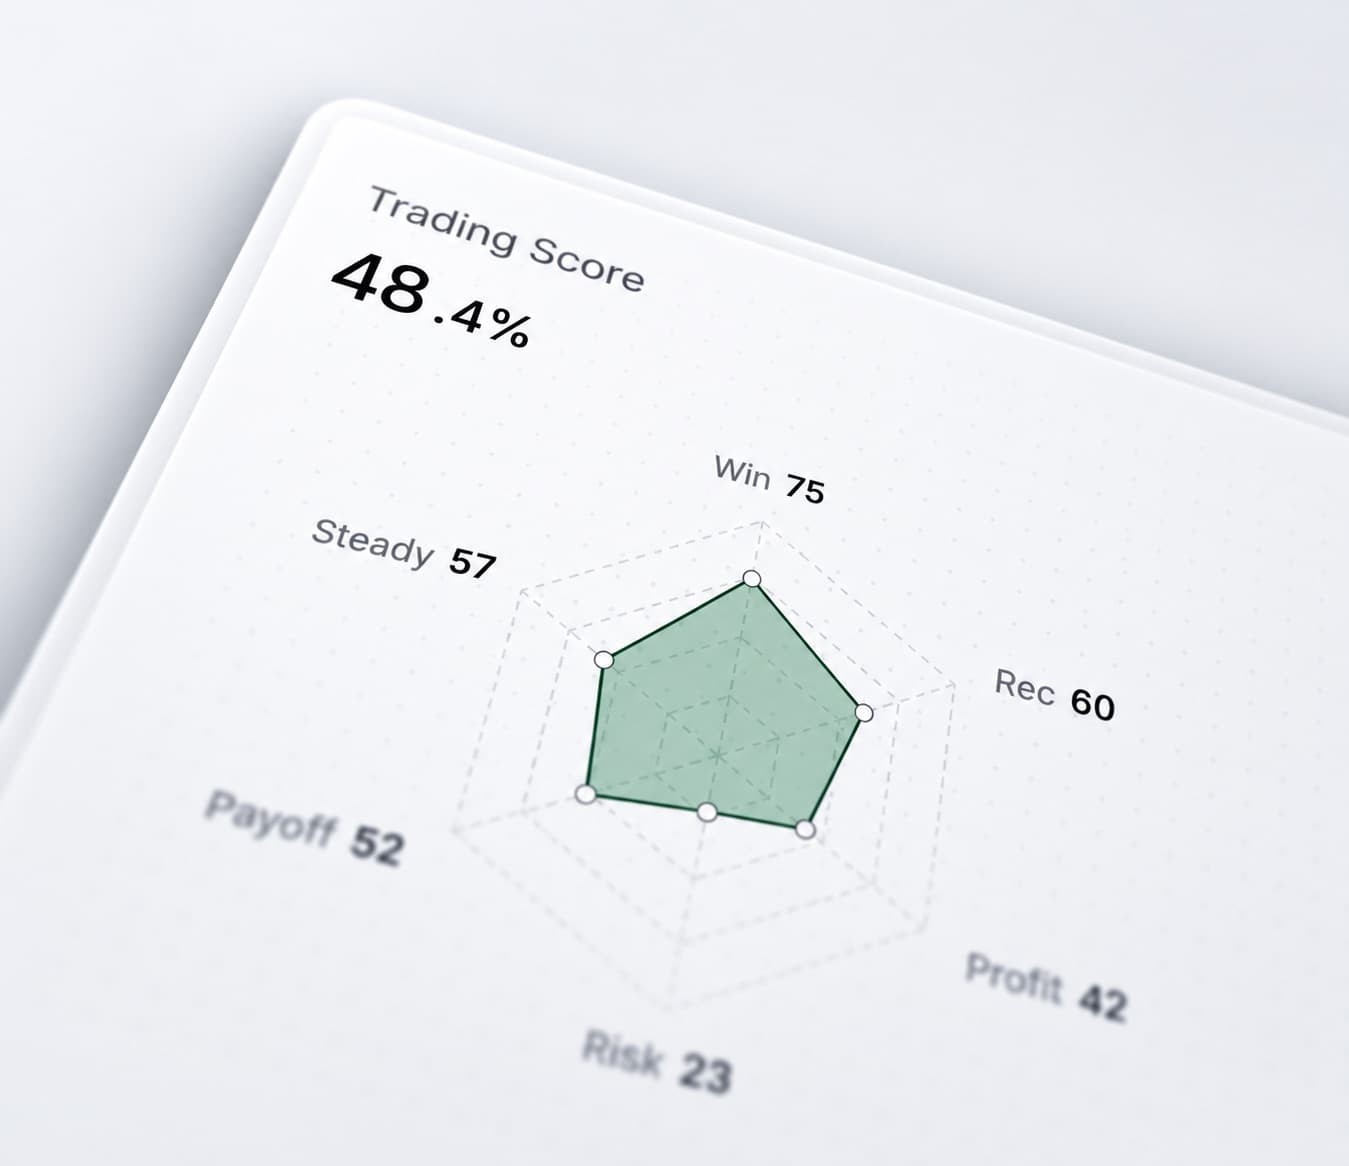
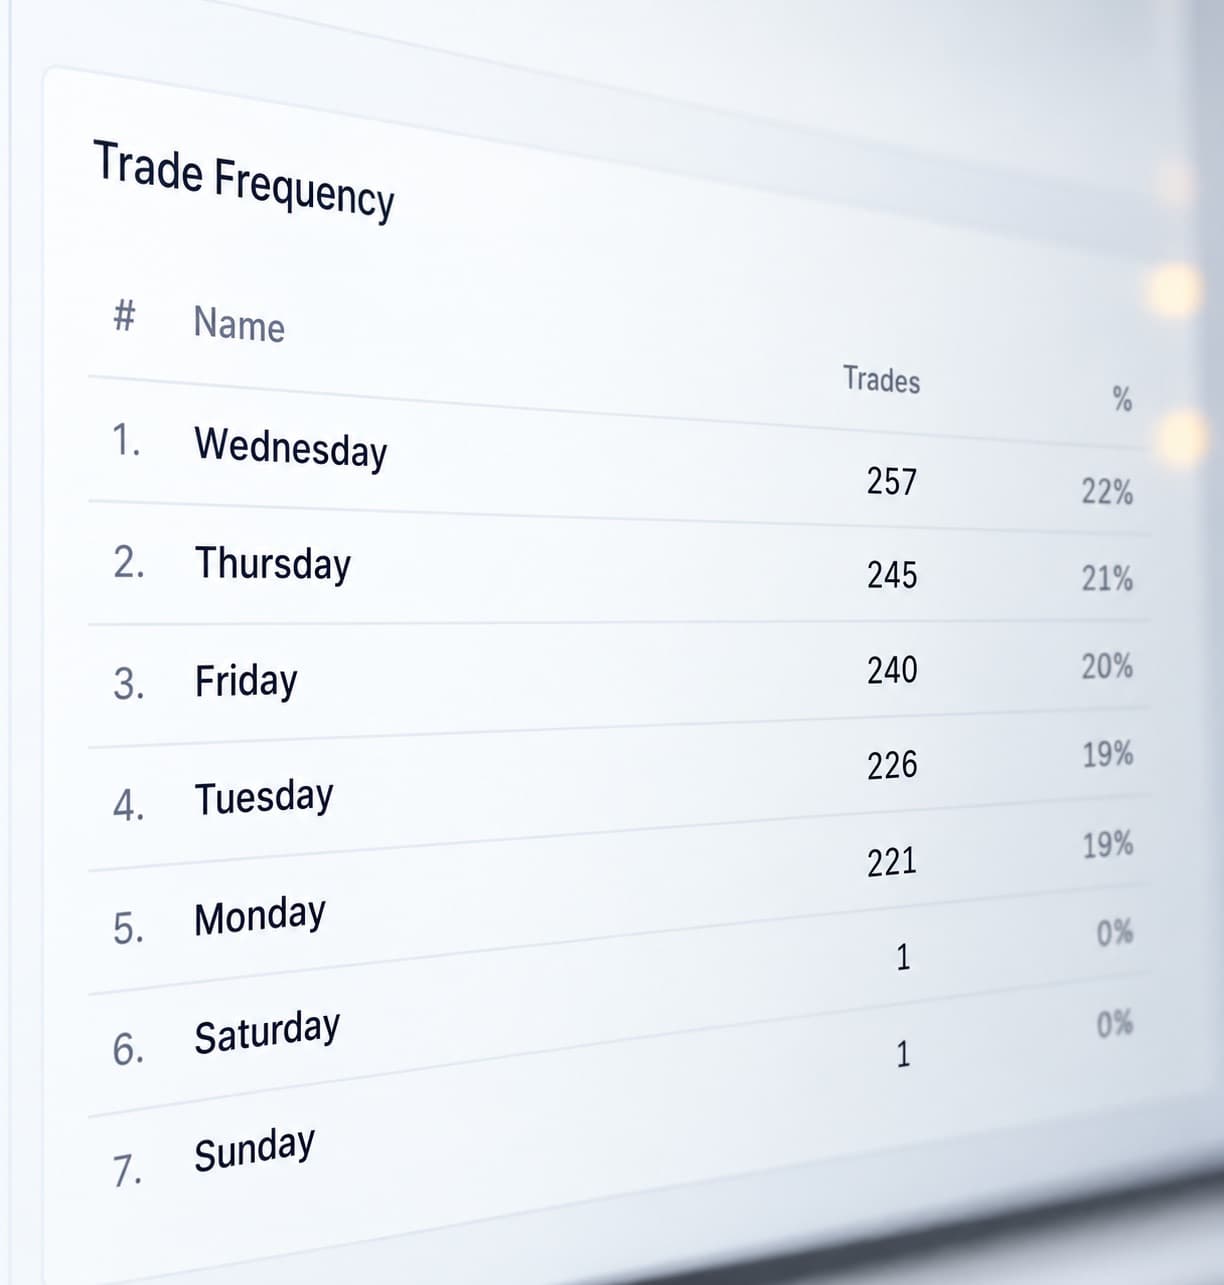
Analyse your trading performance
View statistics calculated from your trading history.
Use your performance data to understand how you are trading over time and identify patterns across your results.
Review more than individual trades by looking at your performance across a larger sample.
10Reports
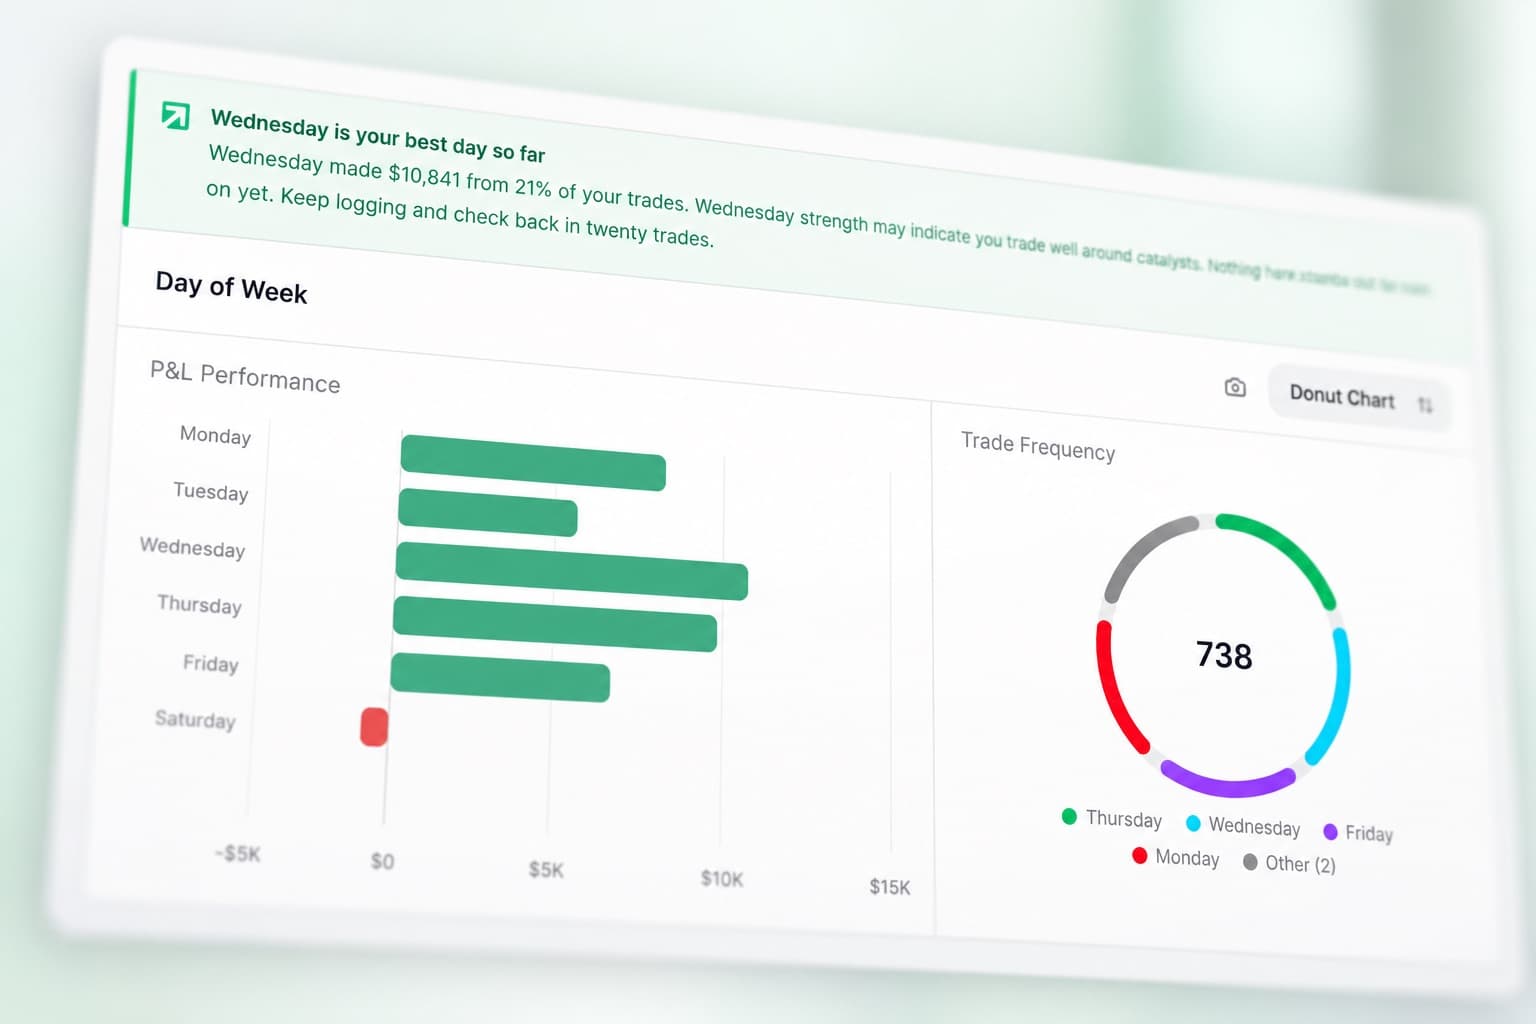
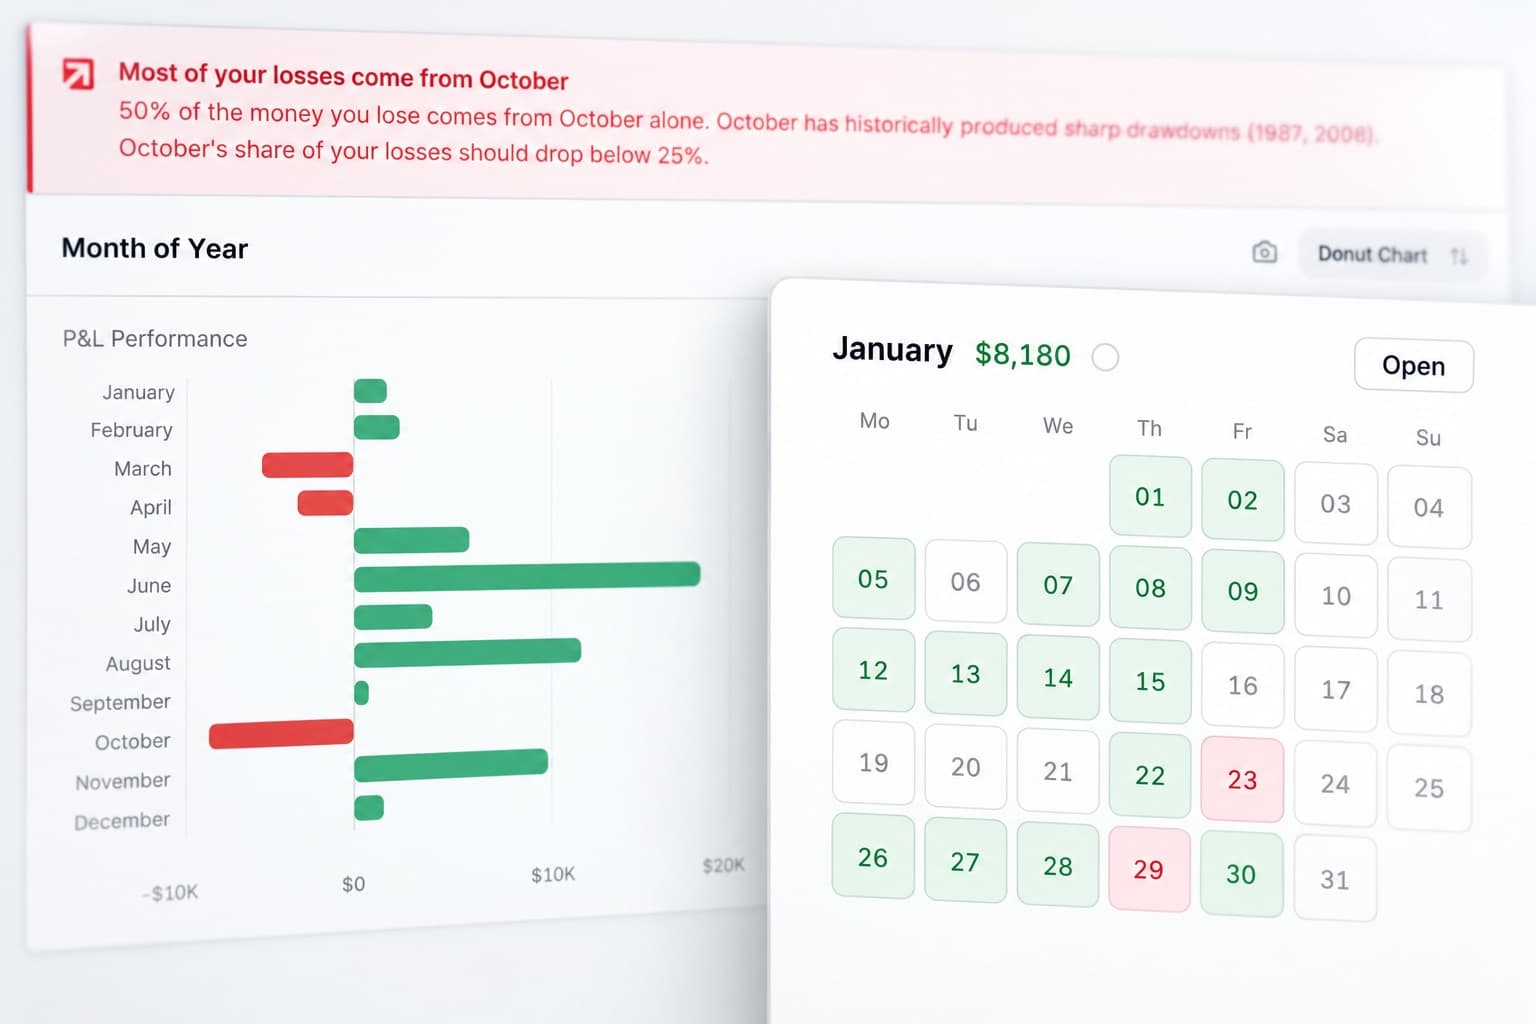
Break down your trading data
Use reports to analyse specific parts of your trading performance.
Filter and compare your trades to understand how different strategies, symbols, time periods and other variables affect your results.
Reports make it easier to identify what is performing well and where your results are weaker.
11Trading Efficiency
Measure how efficiently you manage your trades
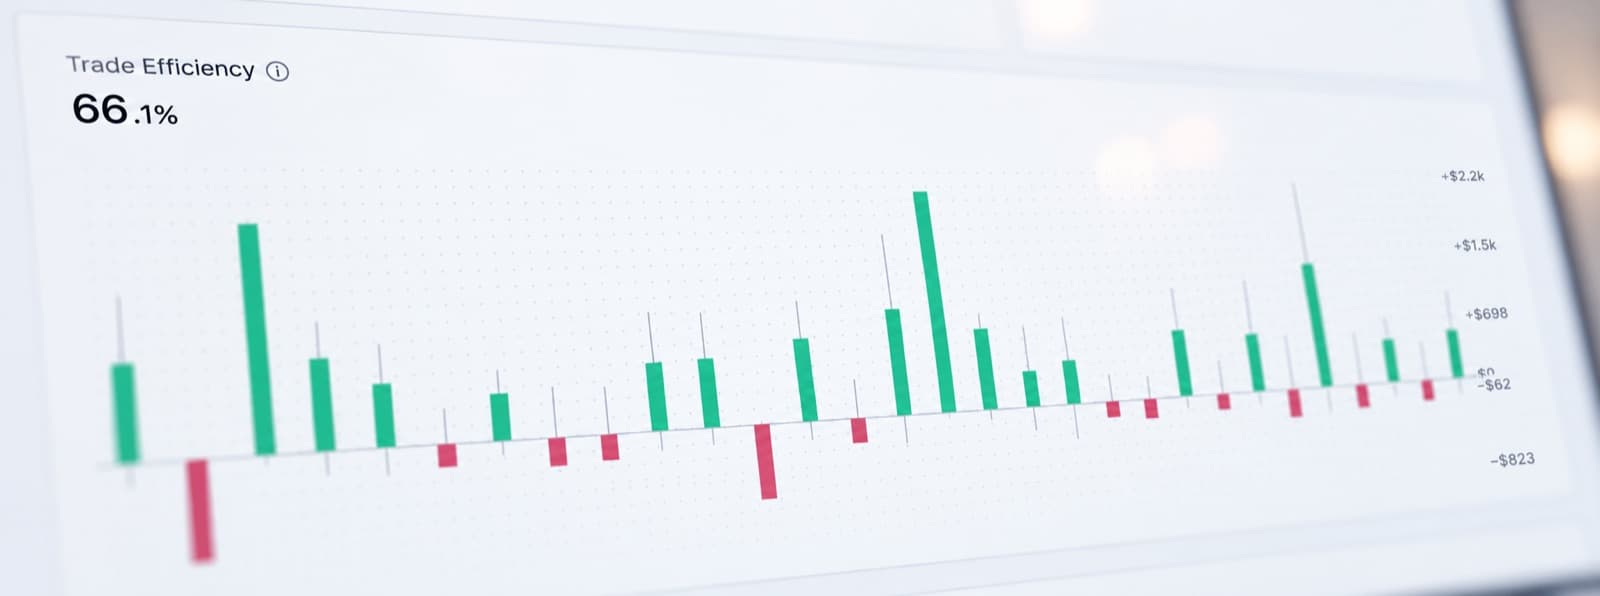
Review how efficiently you entered, managed and exited your trades.
Trading Efficiency helps you understand how much of the available move you captured and where your execution could have been better.
Use it to identify patterns such as exiting too early or giving back too much profit before closing a trade.
12Trading Mentor AI
Ask AI questions about your trading
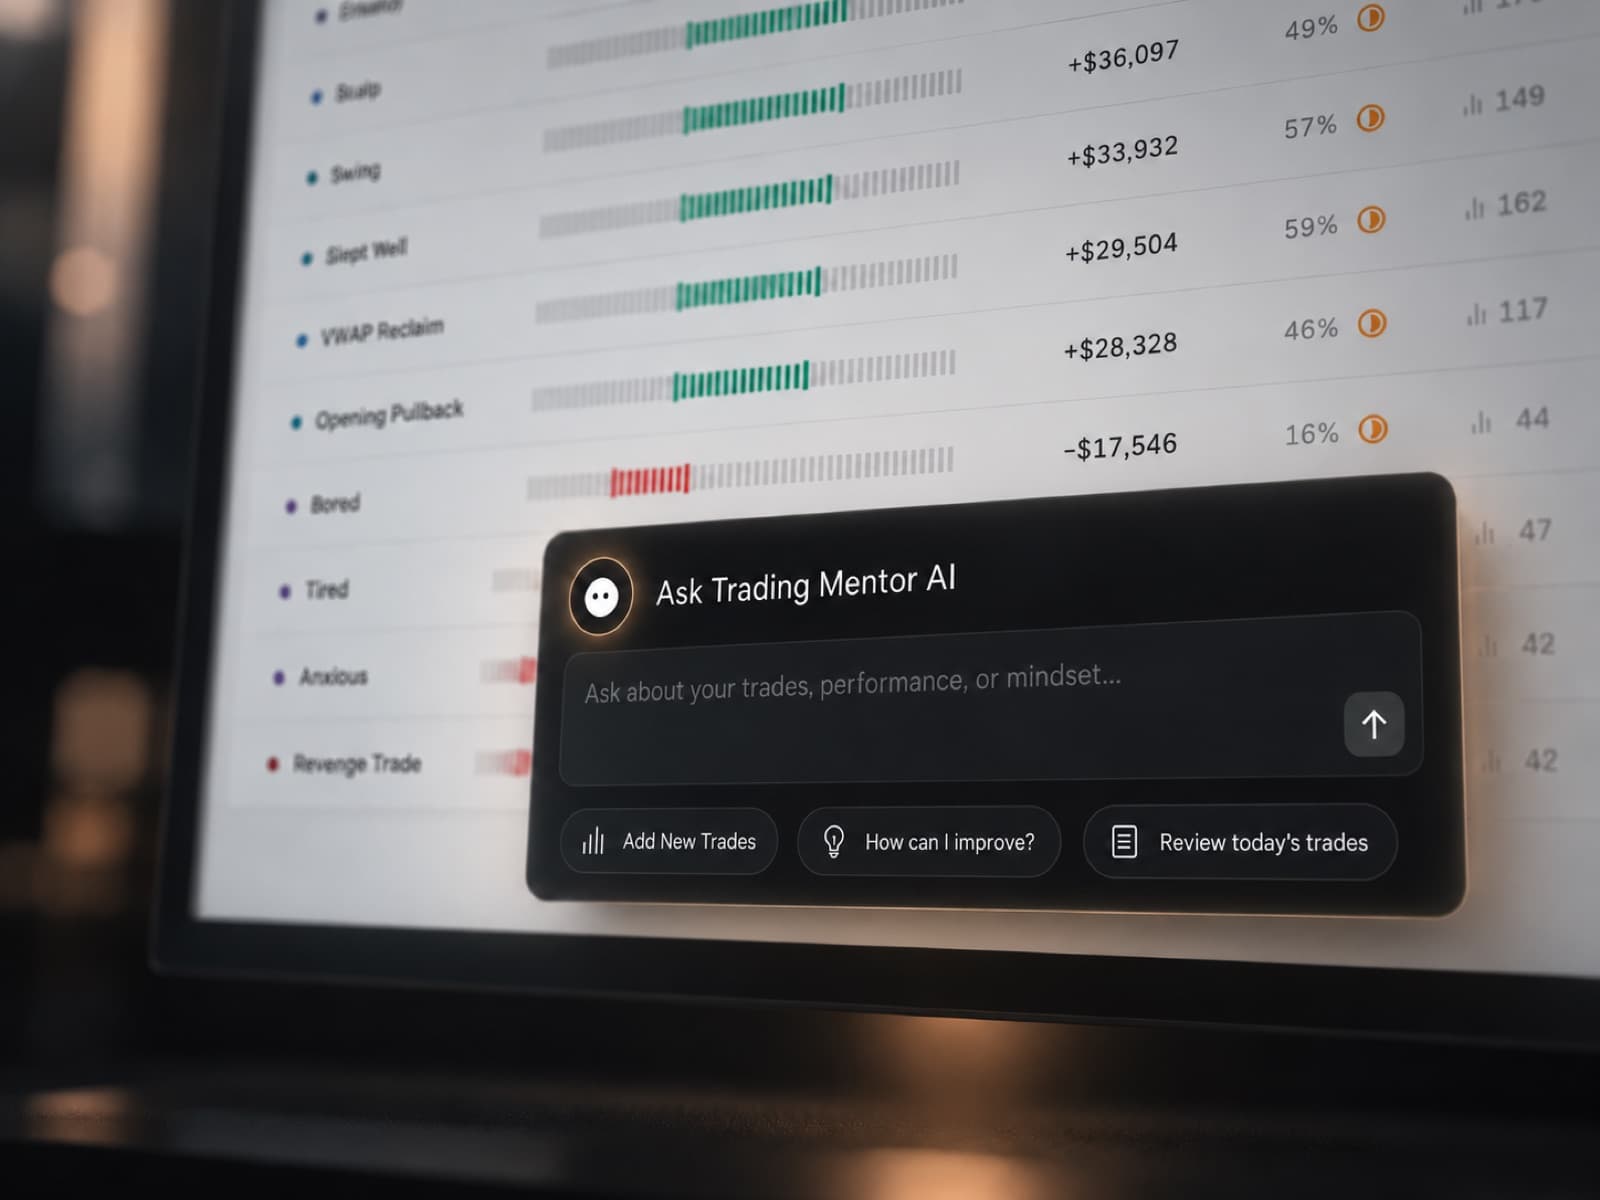
Use Trading Mentor AI to analyse your trading data and help you understand your performance.
Ask questions about your trades, behaviour and journal history instead of manually searching through your data.
Use it to identify patterns, review mistakes and get more context from the information already stored in RizeTrade.