
Fidelity Trading Journal
100% FreeNo CC Required
4.8/5 1,794 Reviews
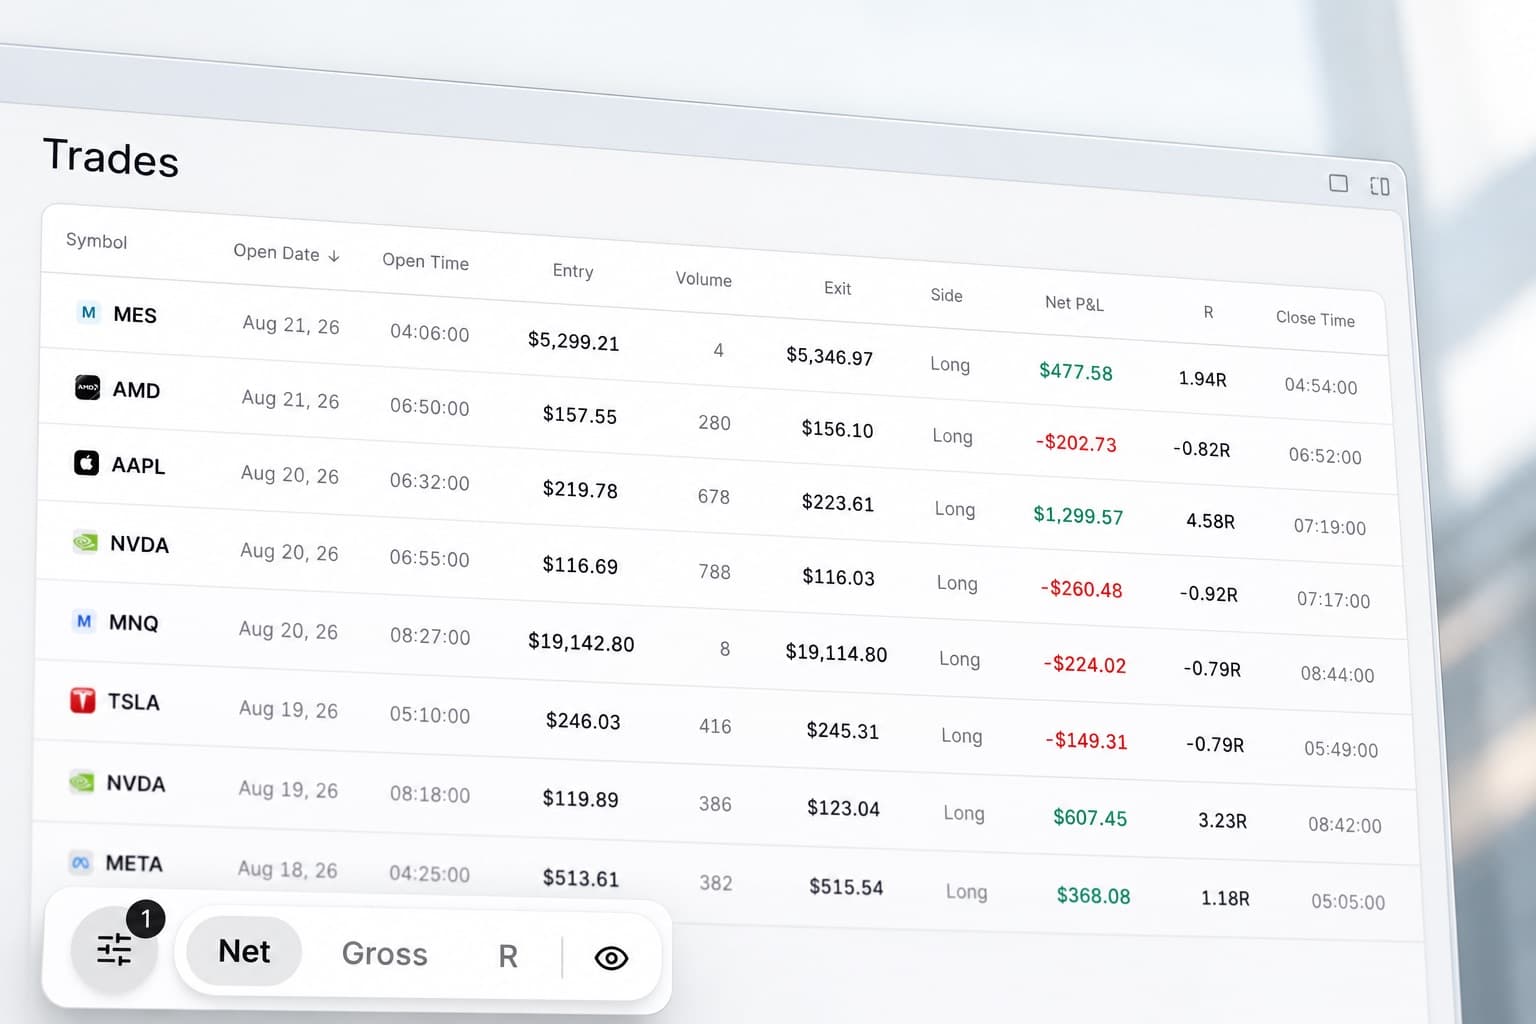
Import your Fidelity trades
Import your Fidelity trades into RizeTrade and review your performance, execution and trading habits in one place.
Bring your trading history into RizeTrade using supported broker sync or file import. You can also enter trades manually whenever you want to add something yourself.
Once your trades are inside RizeTrade, you can review them in more detail instead of relying on trade history alone.
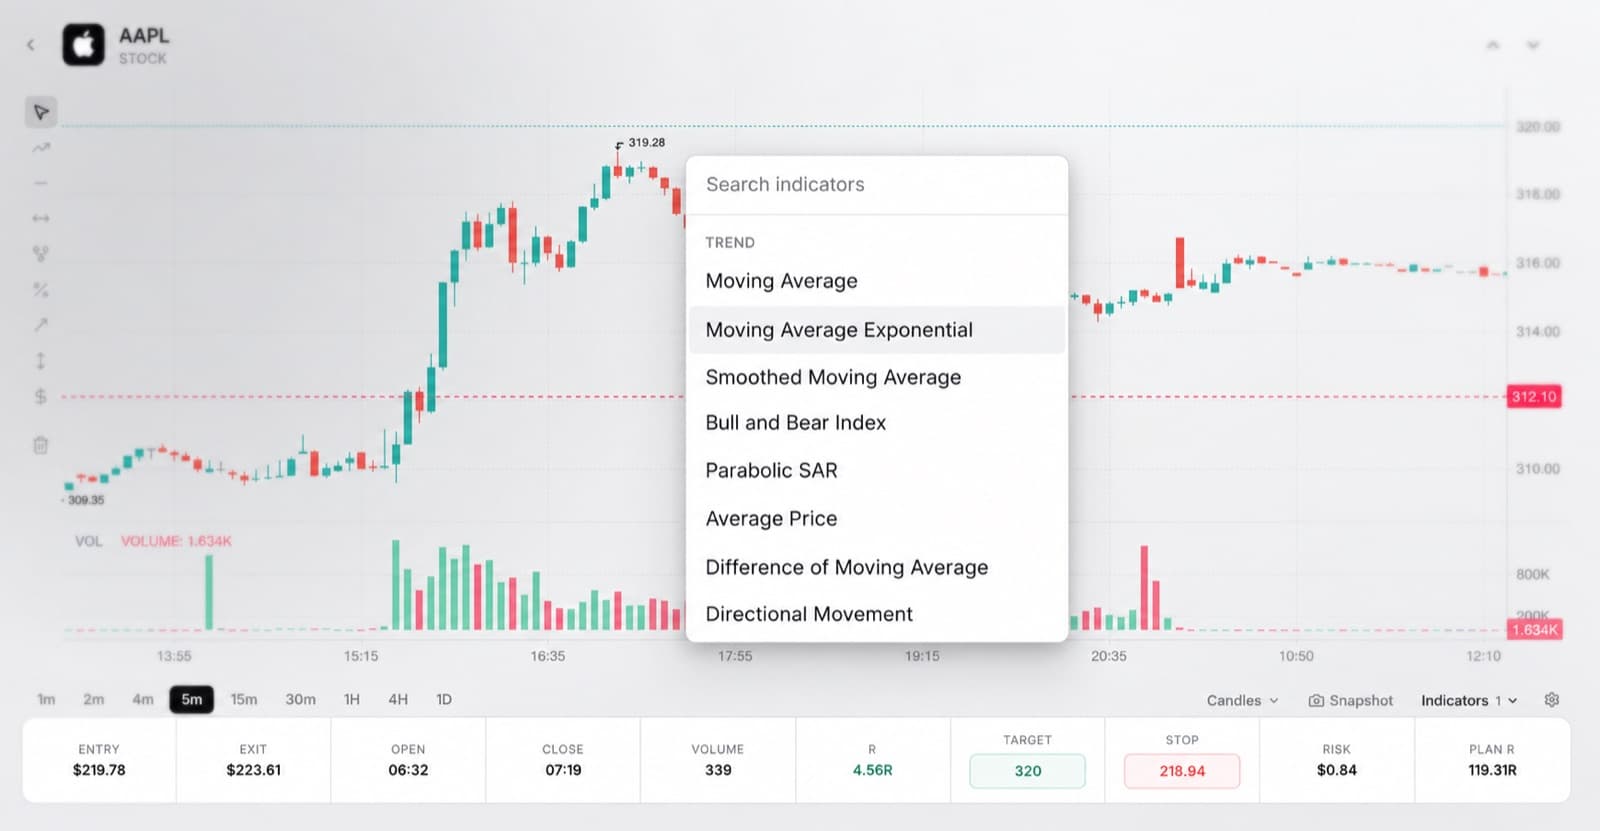
Review trades on the chart
See your past trades in market context.
RizeTrade shows where you entered and exited, making it easier to review your timing and see how the trade developed.
Look back at the setup, your execution and what happened after you closed the position.
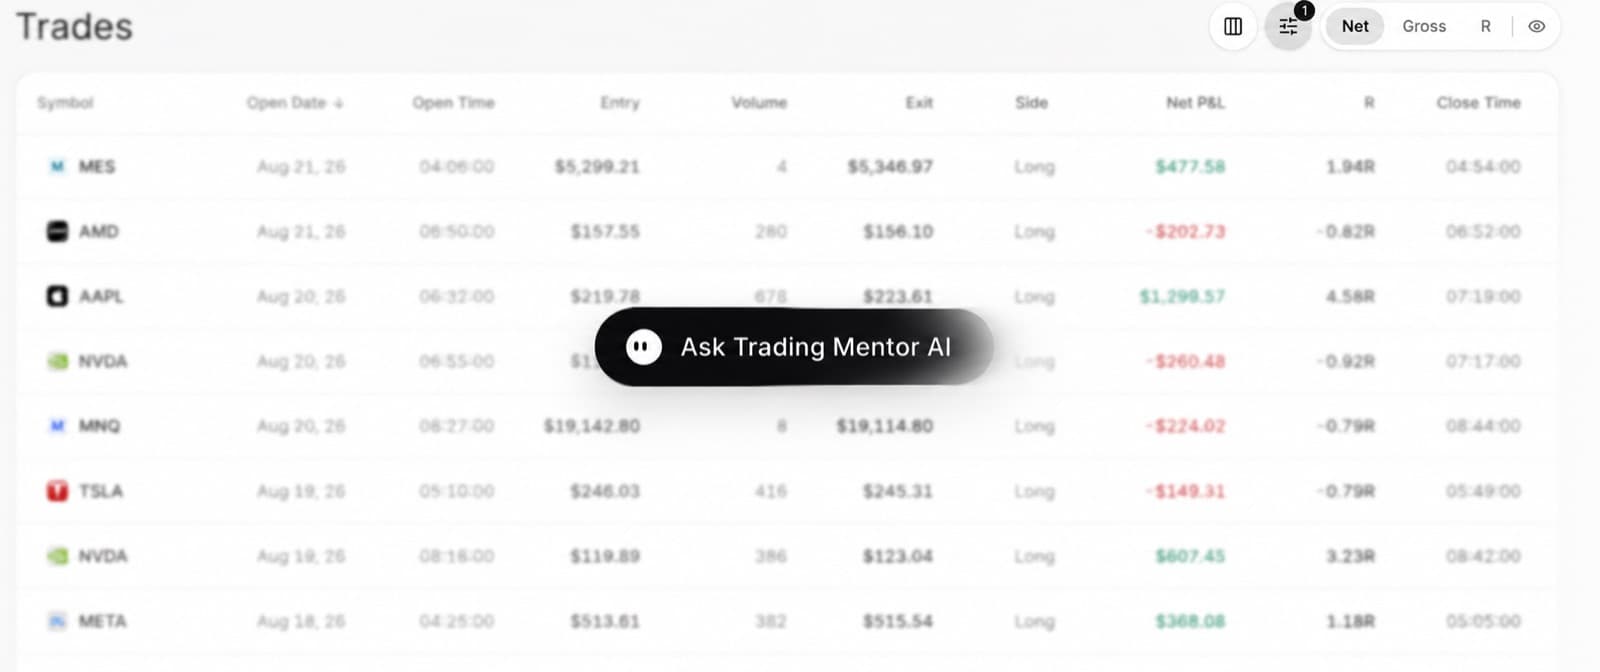
Analyse your journal with AI
Trading Mentor AI helps you explore patterns across your trading history. Ask questions about your own trades, results and behaviour.
- Which trades have my strongest execution?
- What do my losing trades have in common?
- Am I repeating the same mistakes?
- Which habits appear in my best trades?
- When does my performance start to change?
Use your journal as a source of feedback rather than just a record.
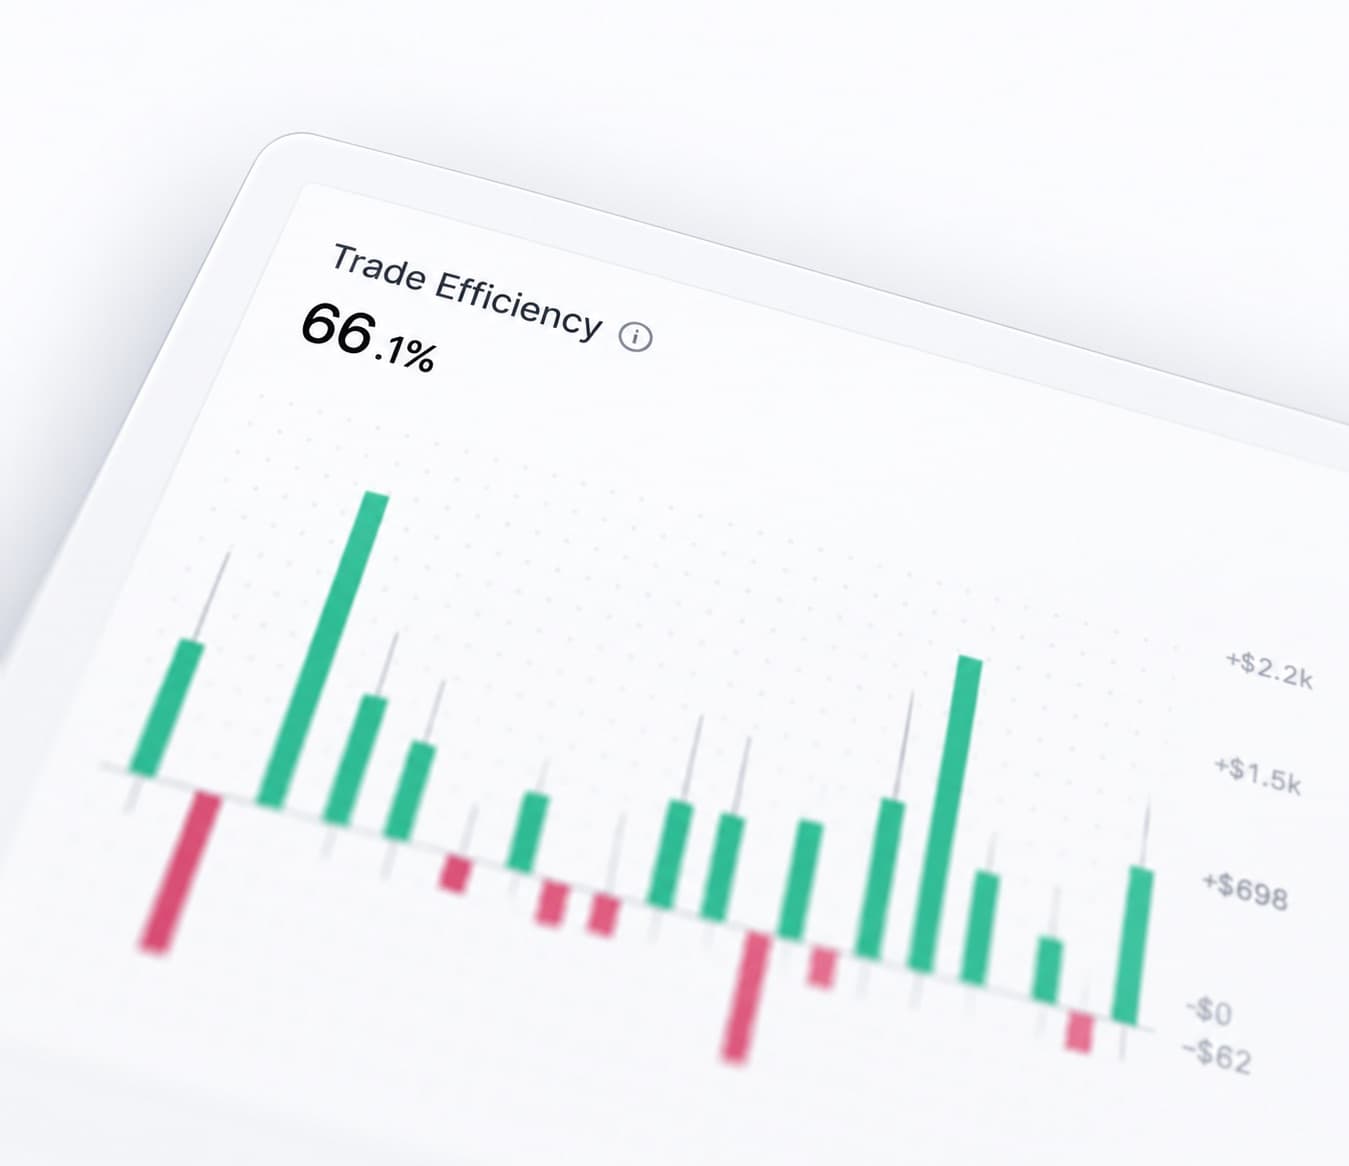
Measure trading efficiency
Winning and losing only tells you part of the story.
Trading Efficiency helps you review how well you handled the trade itself, including whether your execution matched the opportunity.
This gives you another way to identify trades that were handled well and trades where the result may hide weak execution.
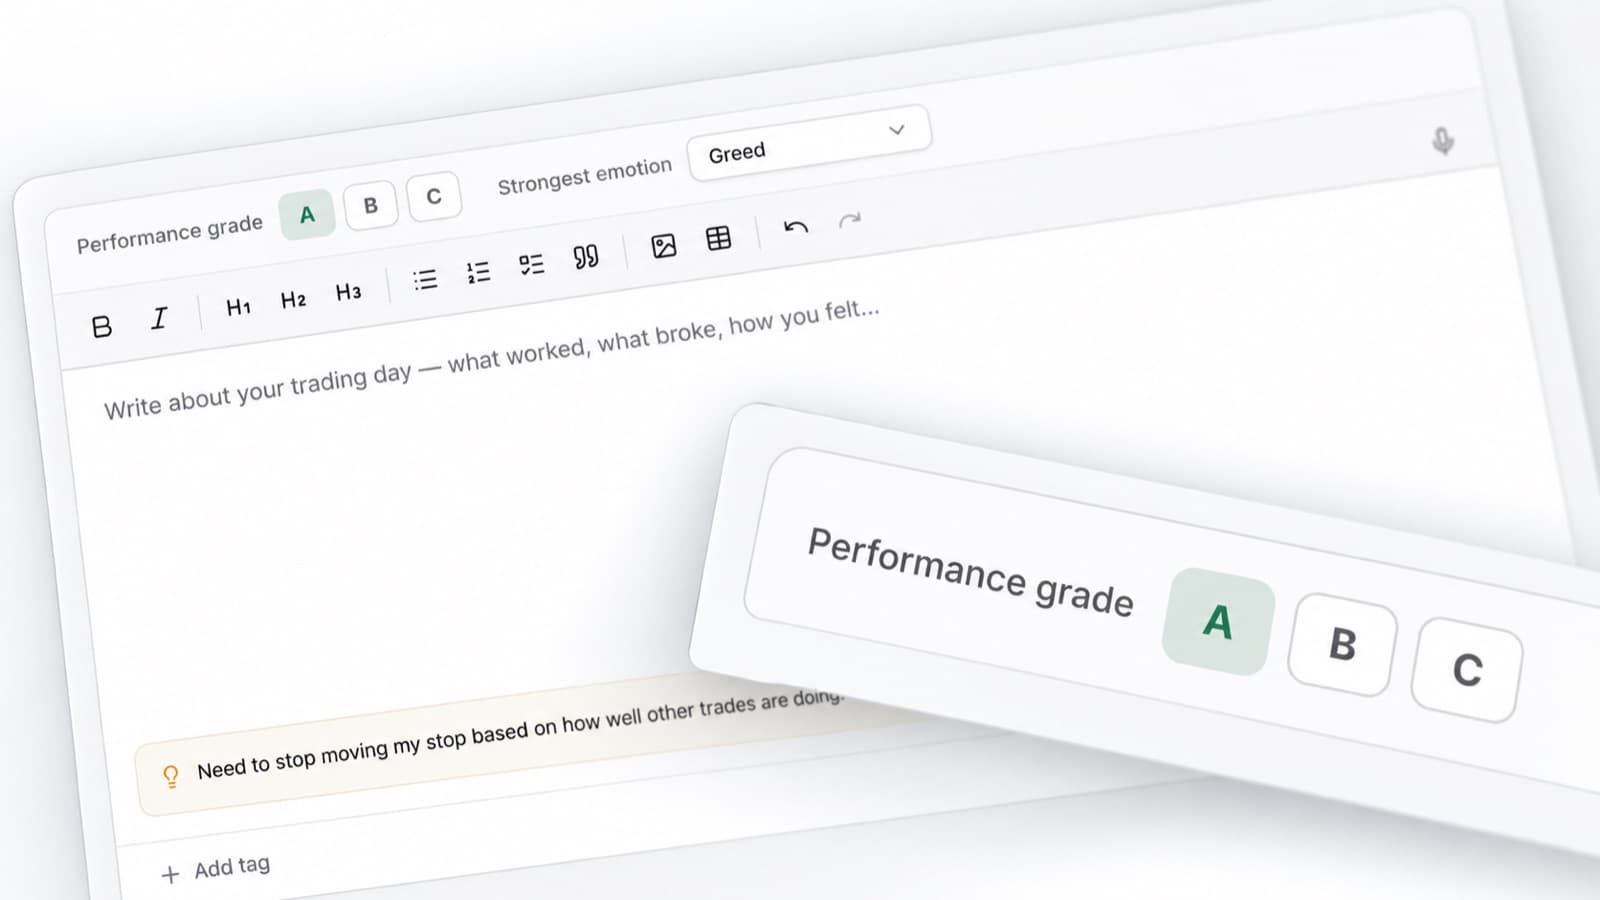
Grade your trades
Trade Grade lets you score the quality of each trade separately from its P&L.
A trade can make money without being a decision you want to repeat. Another can lose while still following your process correctly.
Grading trades helps you focus on consistency rather than judging everything by the result.
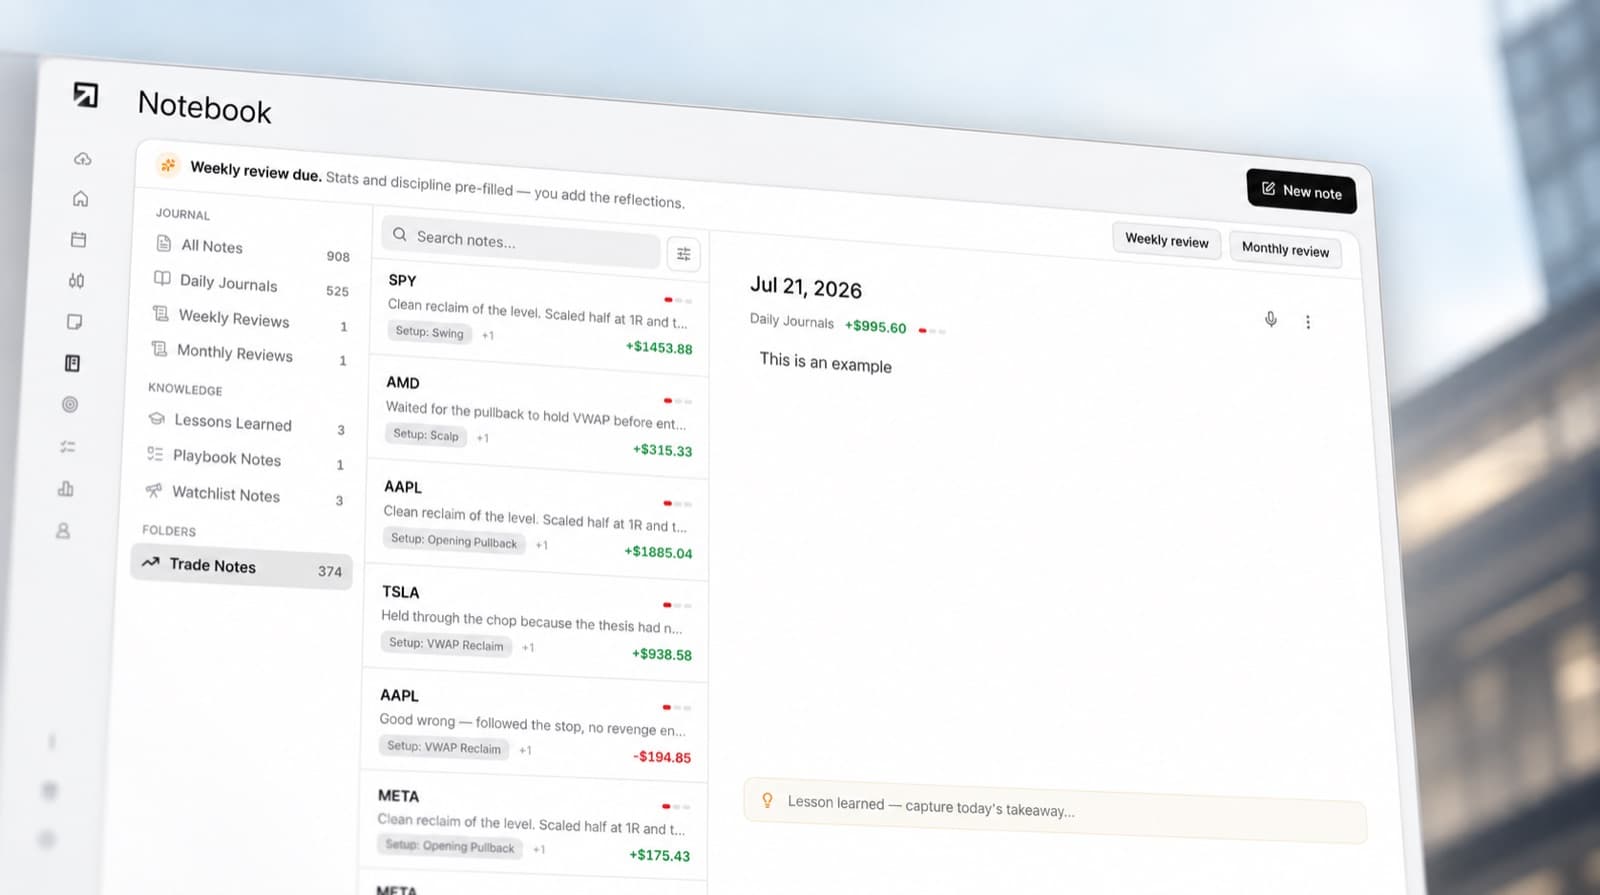
Add notes and context
Keep the reasoning behind your trades alongside the numbers.
Record why you entered, what you expected and anything you noticed during the position.
When you return to the trade later, you have more than an entry price and exit price to work from.
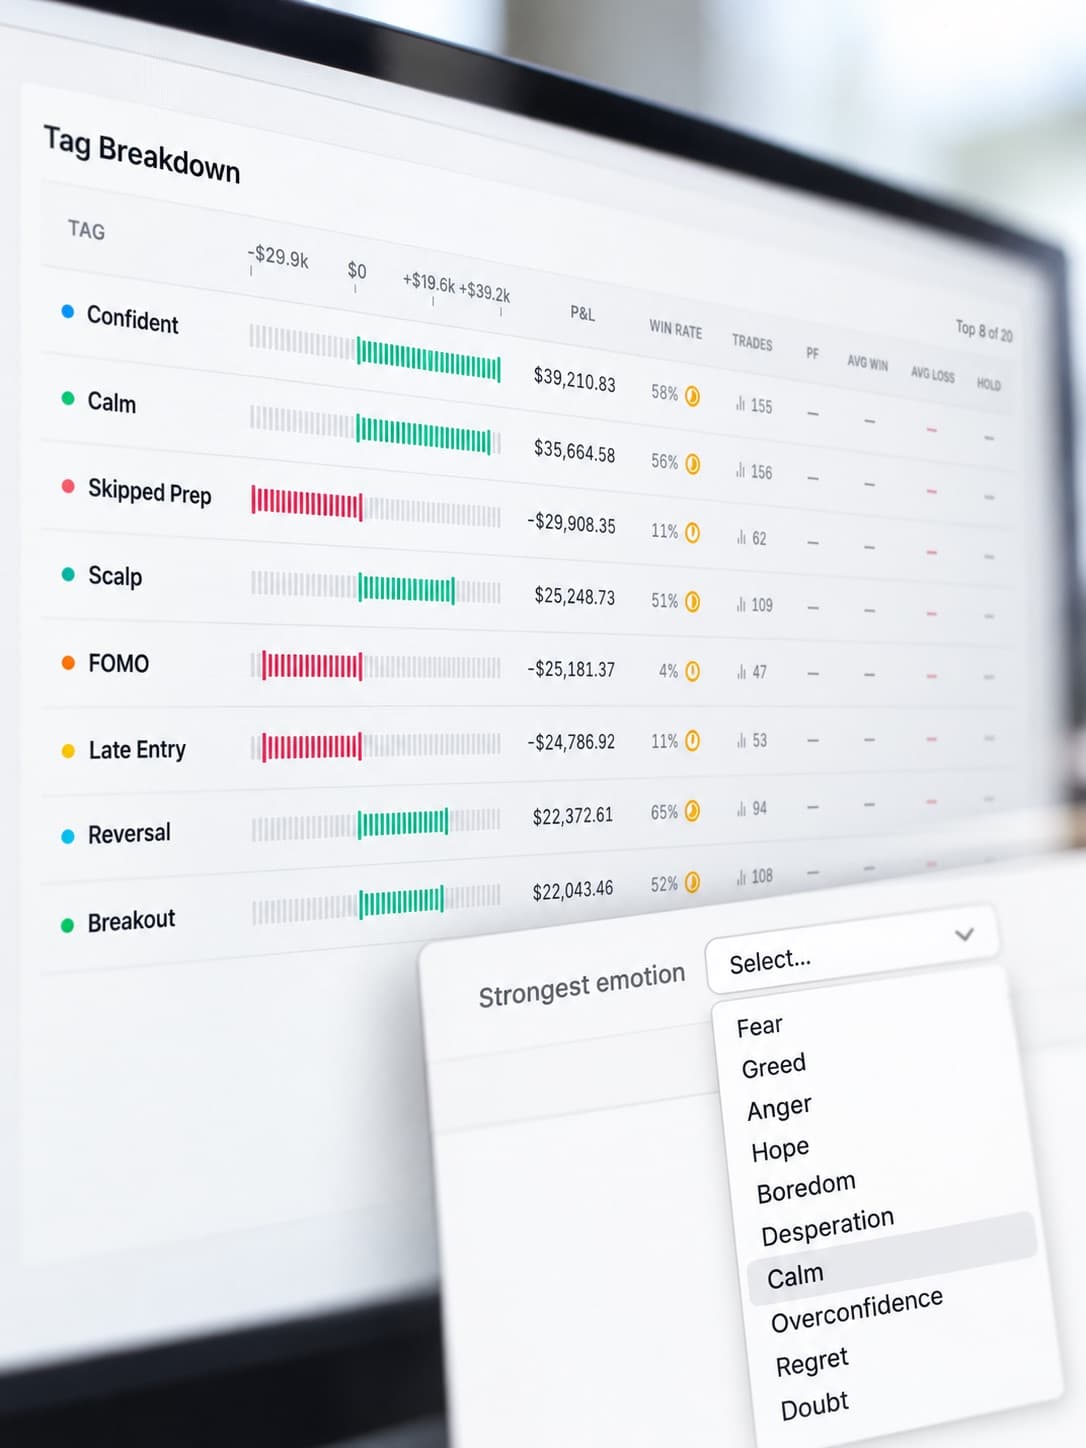
Track your emotions
Record how you felt when making the decision.
- Patient
- Confident
- Frustrated
- Hesitant
- Impulsive
As your journal grows, you can compare those emotions against your results, execution and trade grades.
That can help expose patterns that are difficult to notice while you are trading.
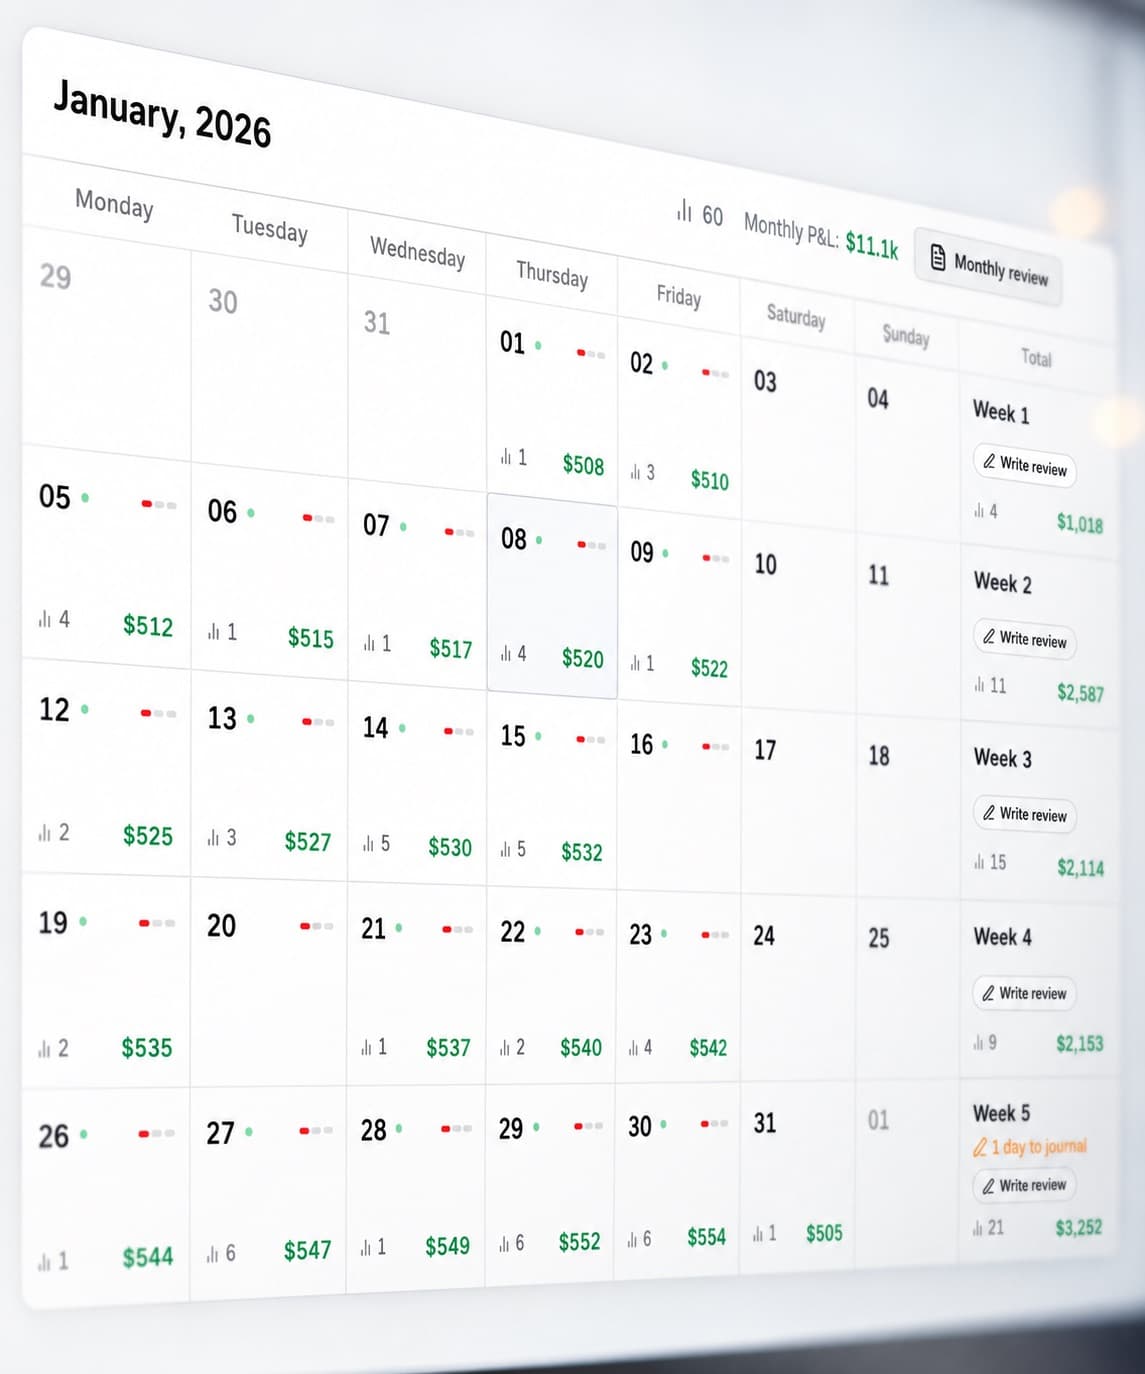
View your P&L calendar
See how your results are distributed across the month.
The P&L Calendar makes it easy to spot stronger days, difficult periods and changes in trading activity.
When a day stands out, open the trades behind it and review what happened.
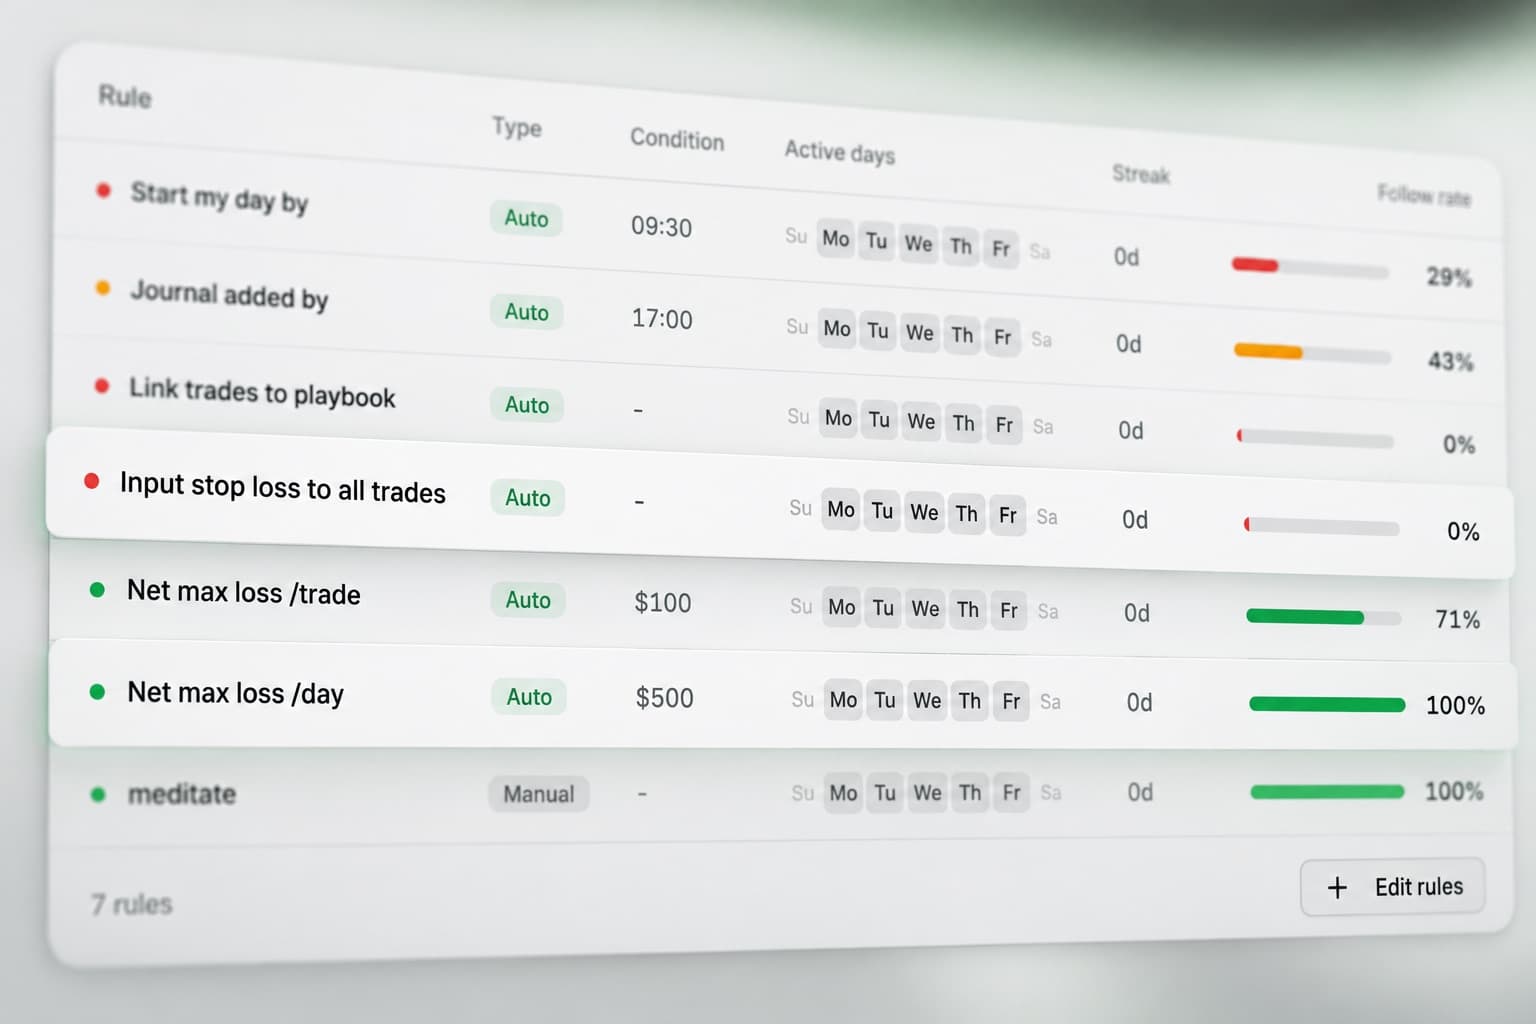
Track your discipline
Use the Discipline Tracker to measure whether you followed your own trading rules.
Choose the behaviours you care about and record whether each trade matched your process.
Over time, you can compare disciplined trading with the periods where you started moving away from your plan.
Review your trading statistics
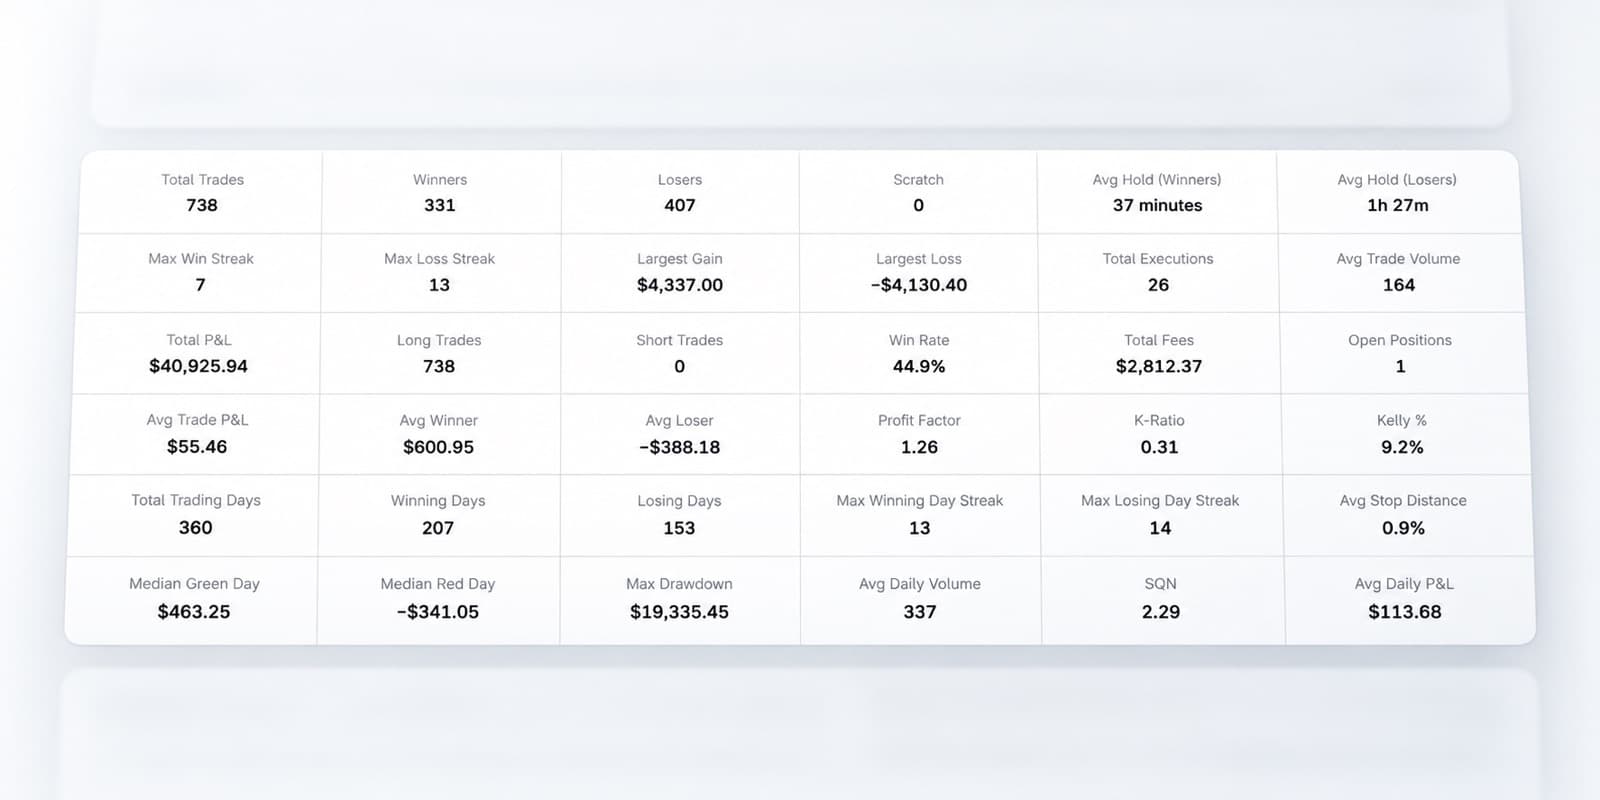
Step back from individual trades and look at your performance across a larger sample.
RizeTrade Statistics help you compare your trading history, spot recurring patterns and see how your results change over time.
The goal is to understand what is consistently happening, not overreact to one trade.
Create journal reports
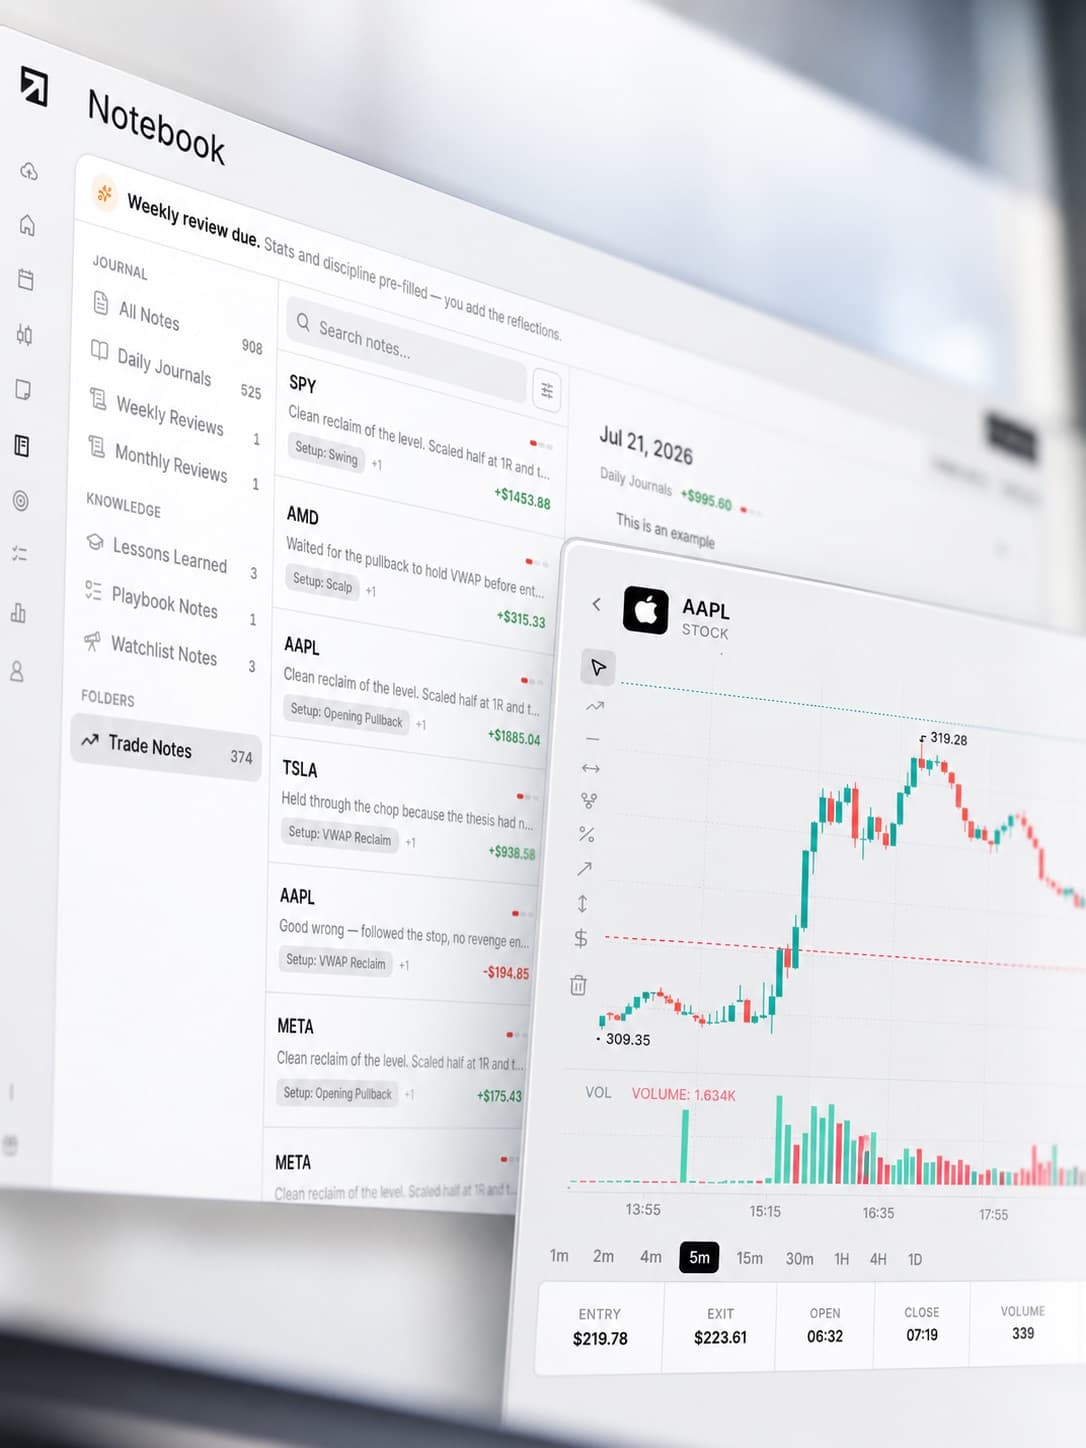
Journal Reports give you a structured way to review your trading history.
Bring together your performance, discipline, trade quality and execution to get a clearer picture of how your trading is developing.
Use them for regular reviews instead of trying to remember what changed from one period to the next.
Fidelity journal features
Trading Mentor AI
Analyse patterns across your trading history.
Past trade charts
Review previous trades with more context.
Trading efficiency
Measure the quality of your execution.
Trade grade
Score trades separately from their result.
P&L calendar
See daily trading results across the month.
Broker sync & file import
Bring supported trade data into RizeTrade.
Manual trade entry
Add individual trades yourself.
Emotion tracking
Connect mindset with trading performance.
Discipline tracker
Measure whether you followed your process.
Statistics
Analyse your wider trading history.
Journal reports
Turn your trading data into regular reviews.
Get more from your Fidelity trade history
Your Fidelity account shows you the trades you made. RizeTrade helps you review the decisions behind them.
See how you executed, identify recurring habits and use your history to make each trading review more useful.