

Looking for an alternative?
Chartlog Alternative
Try a trading journal built around discipline, execution and improving your trading process.
Chartlog gives traders journaling, advanced charts, strategy tracking and detailed performance reports.
RizeTrade focuses on what happens behind those numbers.
Import your trades, review them on charts, track your emotions, measure whether you followed your rules and analyse where your execution is costing you.
100% FreeNo CC Required
4.8/5 1,794 Reviews


RizeTrade vs Chartlog
Both RizeTrade and Chartlog let you import trades, review your trading history and analyse your performance.
The difference is what each platform focuses on.
Chartlog puts a strong emphasis on advanced charting, market data, strategy analysis and custom reports.
RizeTrade combines trading analytics with dedicated tools for tracking discipline, emotions, playbook compliance and execution efficiency.
| Feature | RizeTrade | Chartlog |
|---|---|---|
| Trade Imports | Yes | Yes |
| Automatic Broker Sync | Yes | Supported integrations |
| File Import | Yes | Yes |
| Manual Trade Entry | Yes | Yes |
| Trading Journal | Yes | Yes |
| P&L Calendar | Yes | Yes |
| Historical Trade Charts | Yes | Yes |
| Strategy Tracking | Yes | Standard+ |
| Strategy Rules | Yes | Standard+ |
| MAE & MFE | Yes | Yes |
| Tags | Yes | Yes |
| Media Uploads | Yes | Yes |
| Discipline Tracker | Yes | No |
| Consistency Heat Map | Yes | No |
| Emotion Tracking | Yes | No |
| Playbook Compliance Score | Yes | No |
| Trade Grade | Yes | No |
| Exit Efficiency Score | Yes | No |
| Best Exit Analysis | Yes | No |
| Trading Mentor AI | Yes | No |
| Auto-Generated Reports | 50+ | Yes |
| Custom Report Builder | No | Pro |
| Drawing Tools & Studies | Yes | Yes |
| Historical Market Data | Charts | 15+ years |
| Starting Monthly Price | Free | $14.99 |
Choose RizeTrade if you want to understand how your behaviour and execution affect your results.
Choose Chartlog if advanced charting, historical market data and building custom reports are your priorities.
Why Choose RizeTrade Instead of Chartlog?
Analyse More Than Your Trading Statistics
Your win rate can tell you that something is wrong.
It cannot always tell you why.
RizeTrade connects your performance data with information about how you actually traded.
Track:
- Strategy
- Playbook
- Rules followed
- Rules broken
- Trade grade
- Emotional state
- Stops
- Profit targets
- MAE
- MFE
- Exit efficiency
- Notes
- Tags
That lets you investigate the behaviour behind the result instead of stopping at P&L.
Track Your Trading Discipline
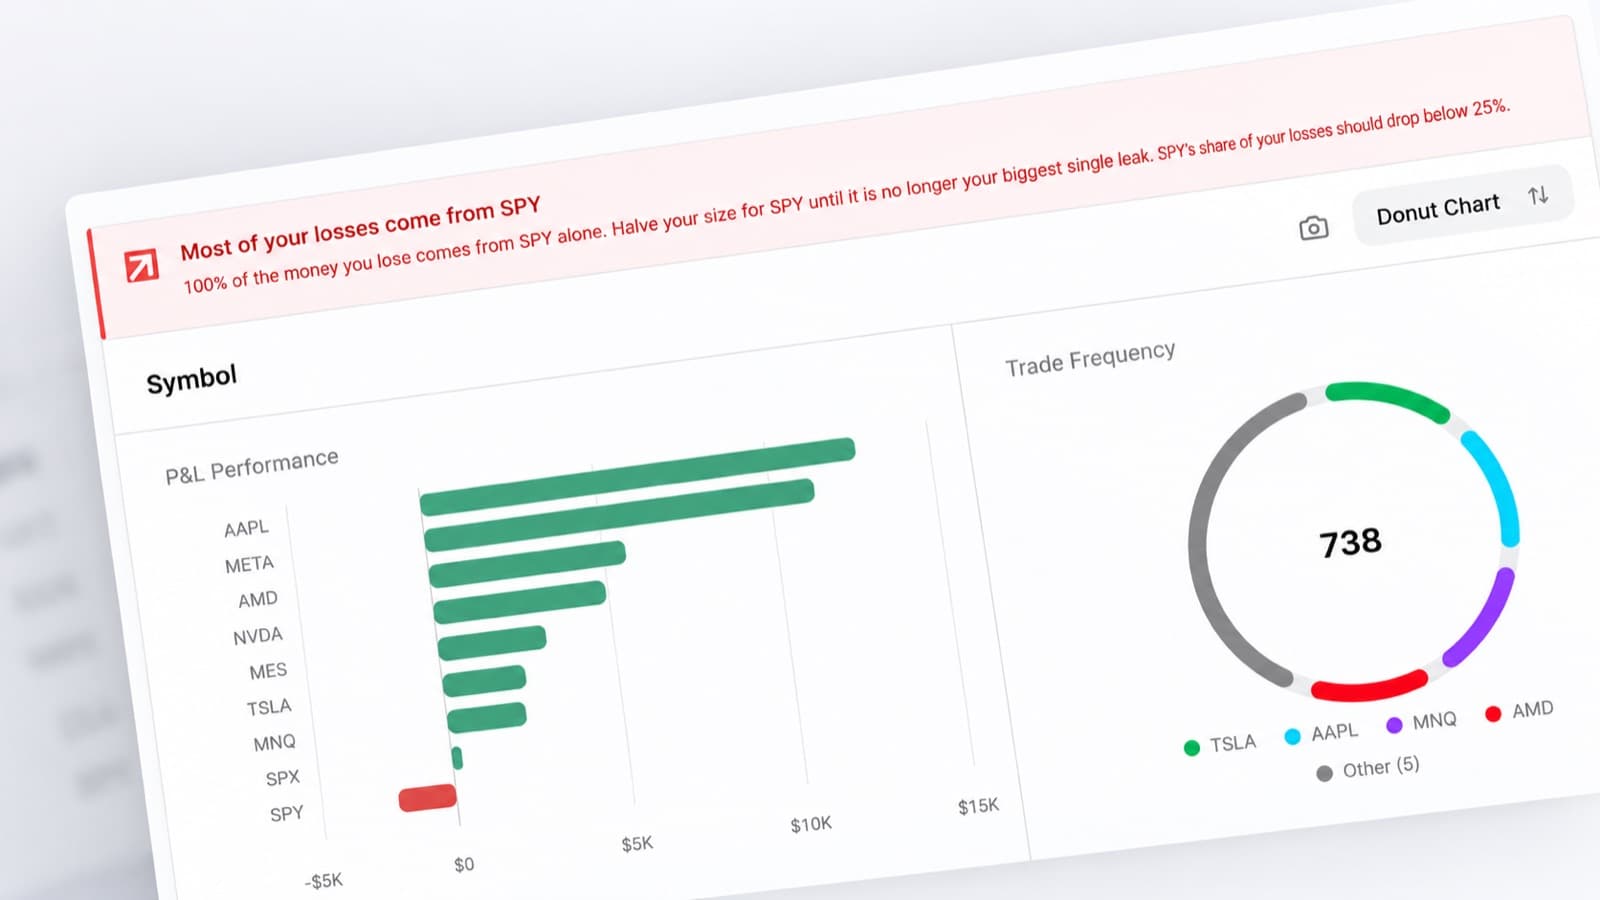
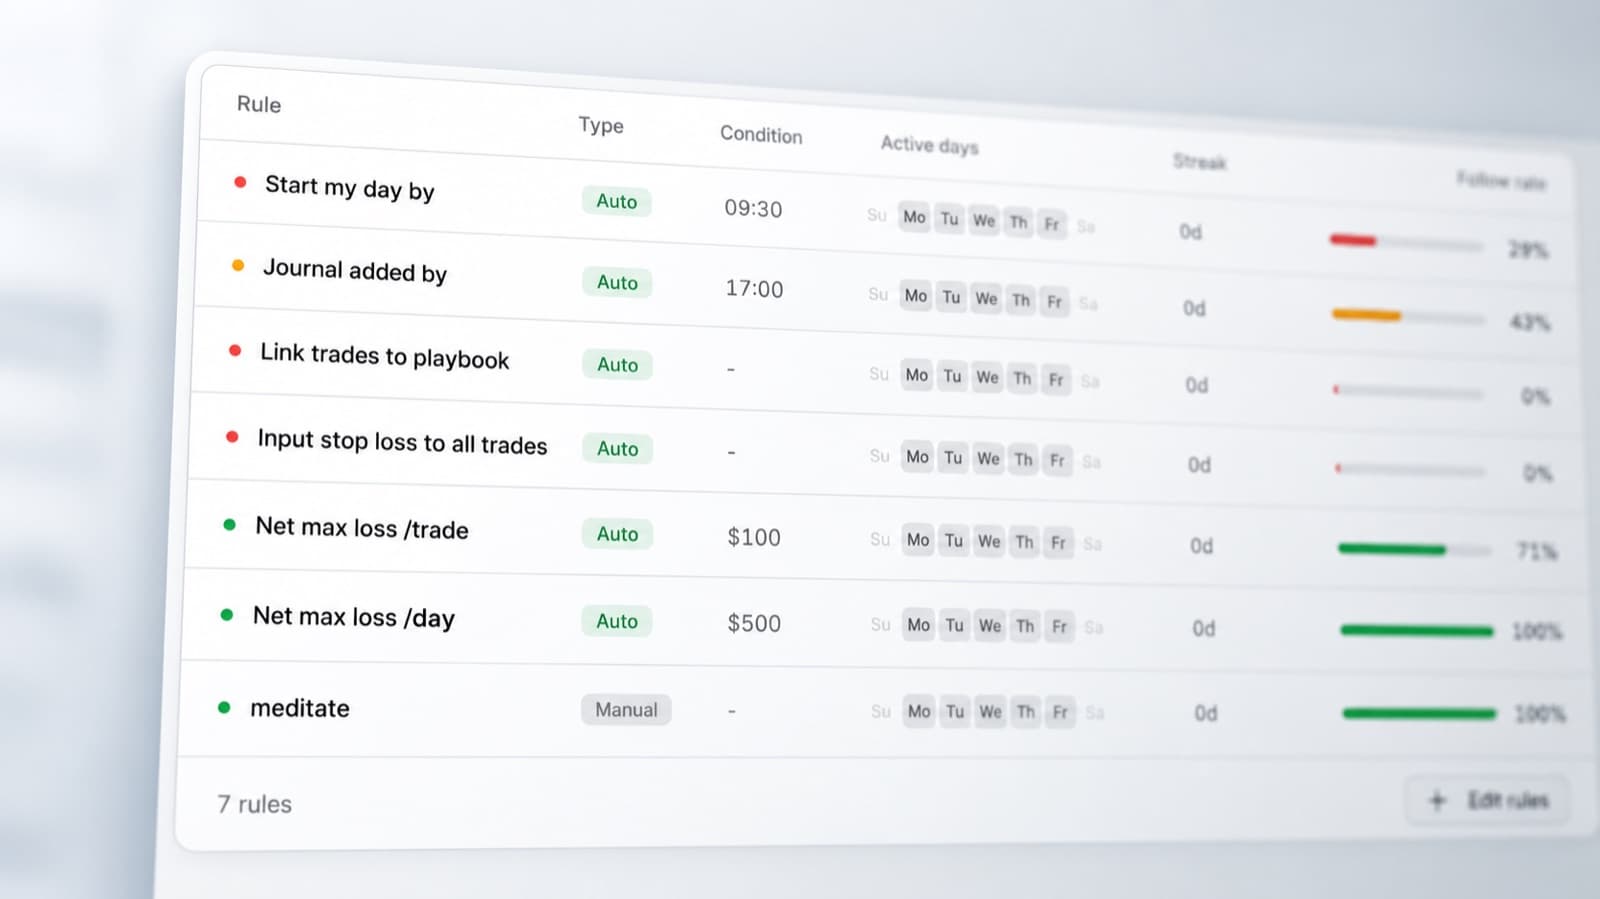
Record whether you actually followed your trading plan
Create the rules you are supposed to follow and track them against your trading history.
RizeTrade's Discipline Tracker helps you see whether you:
- Followed your setup criteria
- Respected your risk limits
- Stuck to your maximum number of trades
- Followed your stop rules
- Avoided overtrading
- Completed your trading routine
Review your discipline across individual trades and across entire trading periods.
Instead of writing “need more discipline” in your journal every Friday, measure it.
Trading Playbooks
Turn each strategy into a repeatable process
Create a playbook for each strategy you trade.
Add the rules that define a valid setup, then score individual trades based on whether those rules were actually followed.
For example, a playbook could include:
- Entry criteria
- Market conditions
- Risk limits
- Stop placement
- Profit target
- Trade management rules
- Exit criteria
RizeTrade calculates your Playbook Compliance Score so you can compare trades where you followed the strategy with trades where you deviated from it.
This helps answer an important question:
Does the strategy not work, or did you simply not trade it correctly?
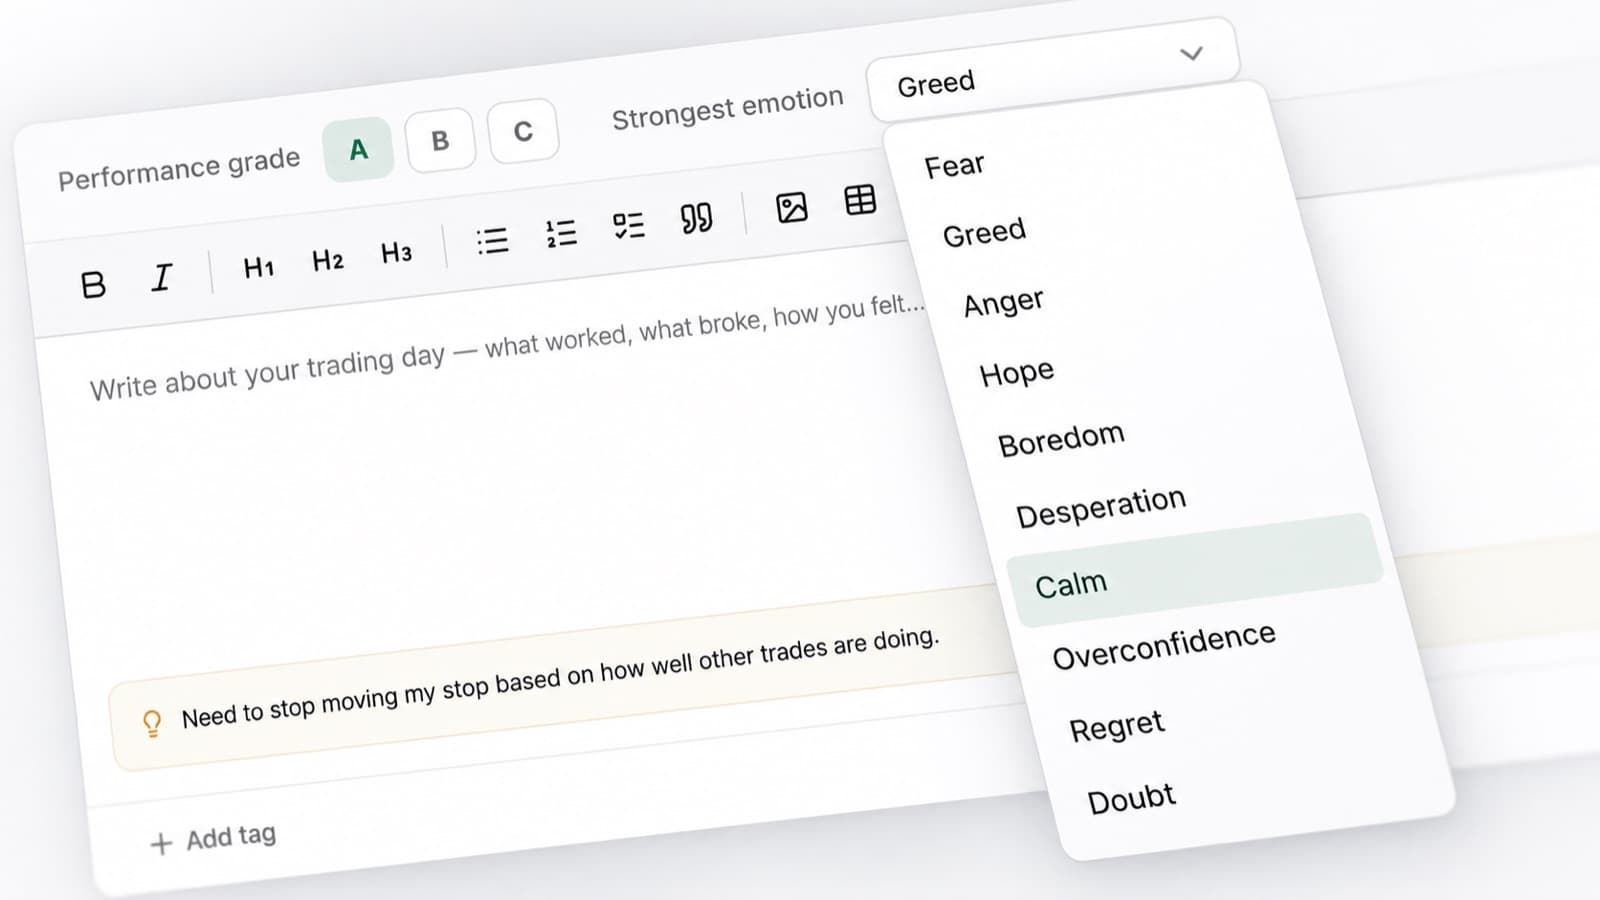
Track Your Emotions
Add trading psychology to your performance data
Record the emotional state associated with each trade.
Track emotions and behaviours such as:
- FOMO
- Fear
- Frustration
- Revenge trading
- Overconfidence
- Boredom
- Hesitation
Then filter your trading history by those emotions.
You can see whether certain states are repeatedly connected with poor entries, rule breaks, oversized positions or bad exits.
Instead of keeping psychology separate from your statistics, RizeTrade lets you analyse them together.
Grade Your Trades
Separate trade quality from trade outcome
A winning trade can still be badly executed.
A losing trade can still follow your plan perfectly.
Use Trade Grade to record how well you actually traded the position rather than allowing P&L to make that decision for you.
Over time, compare your trade grades against your financial results.
The goal is to identify which behaviours are repeatable, not which mistakes happened to make money.
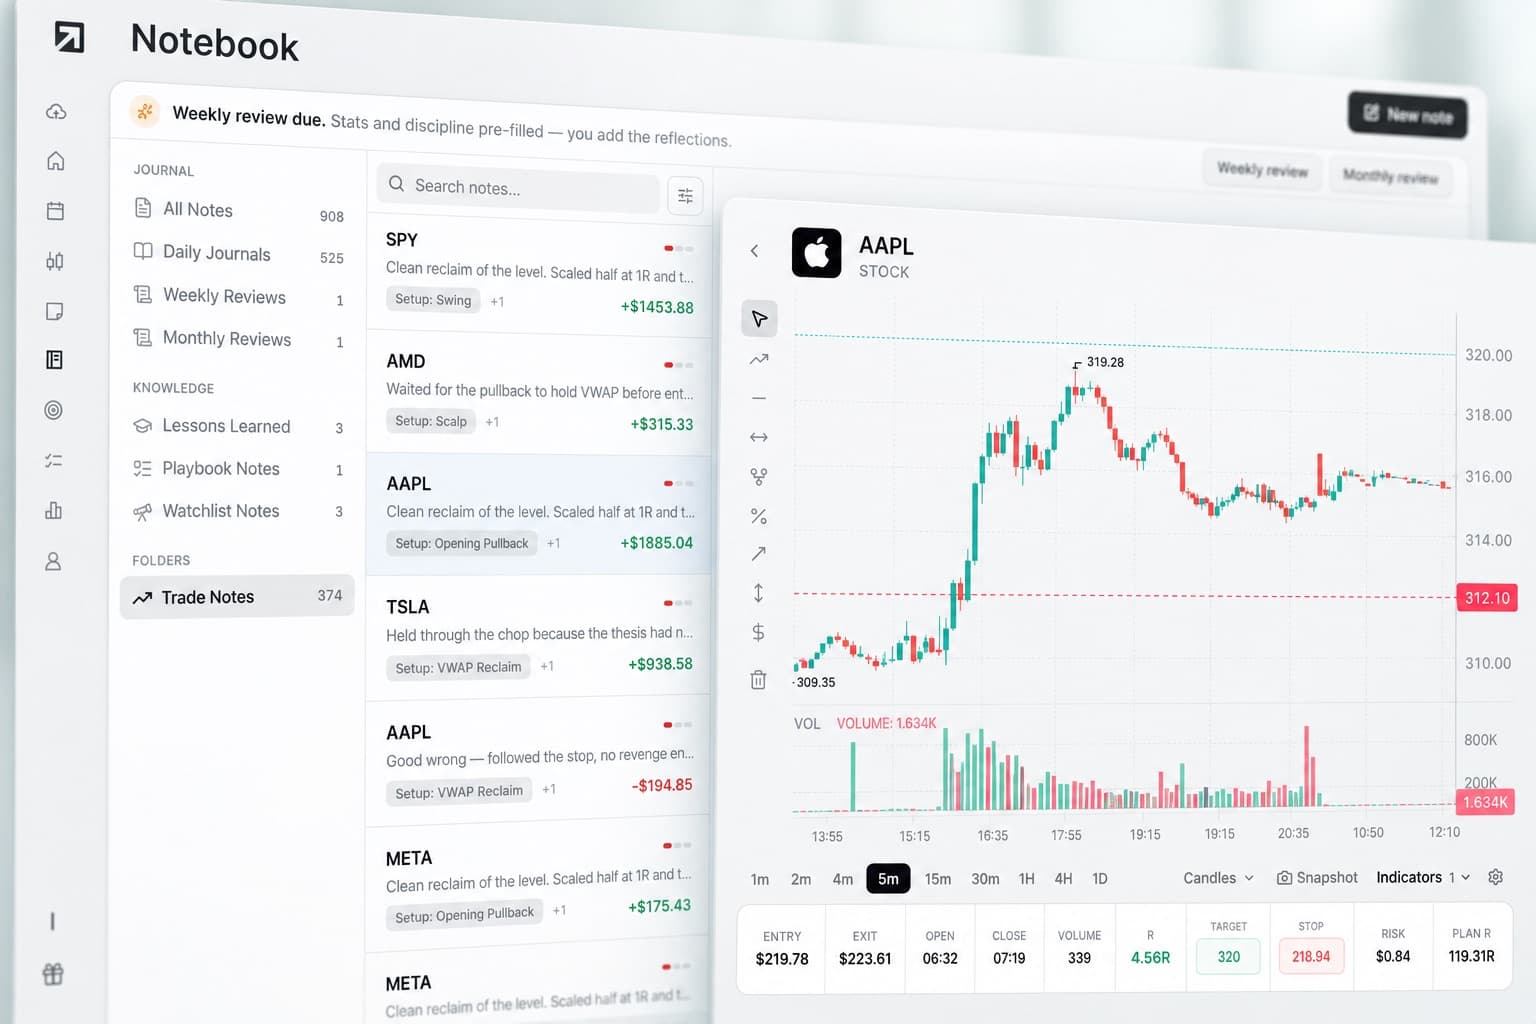
One row from that list
“Good wrong, followed the stop, no revenge entry.”
Review Your Trades on a Chart
See where every execution happened
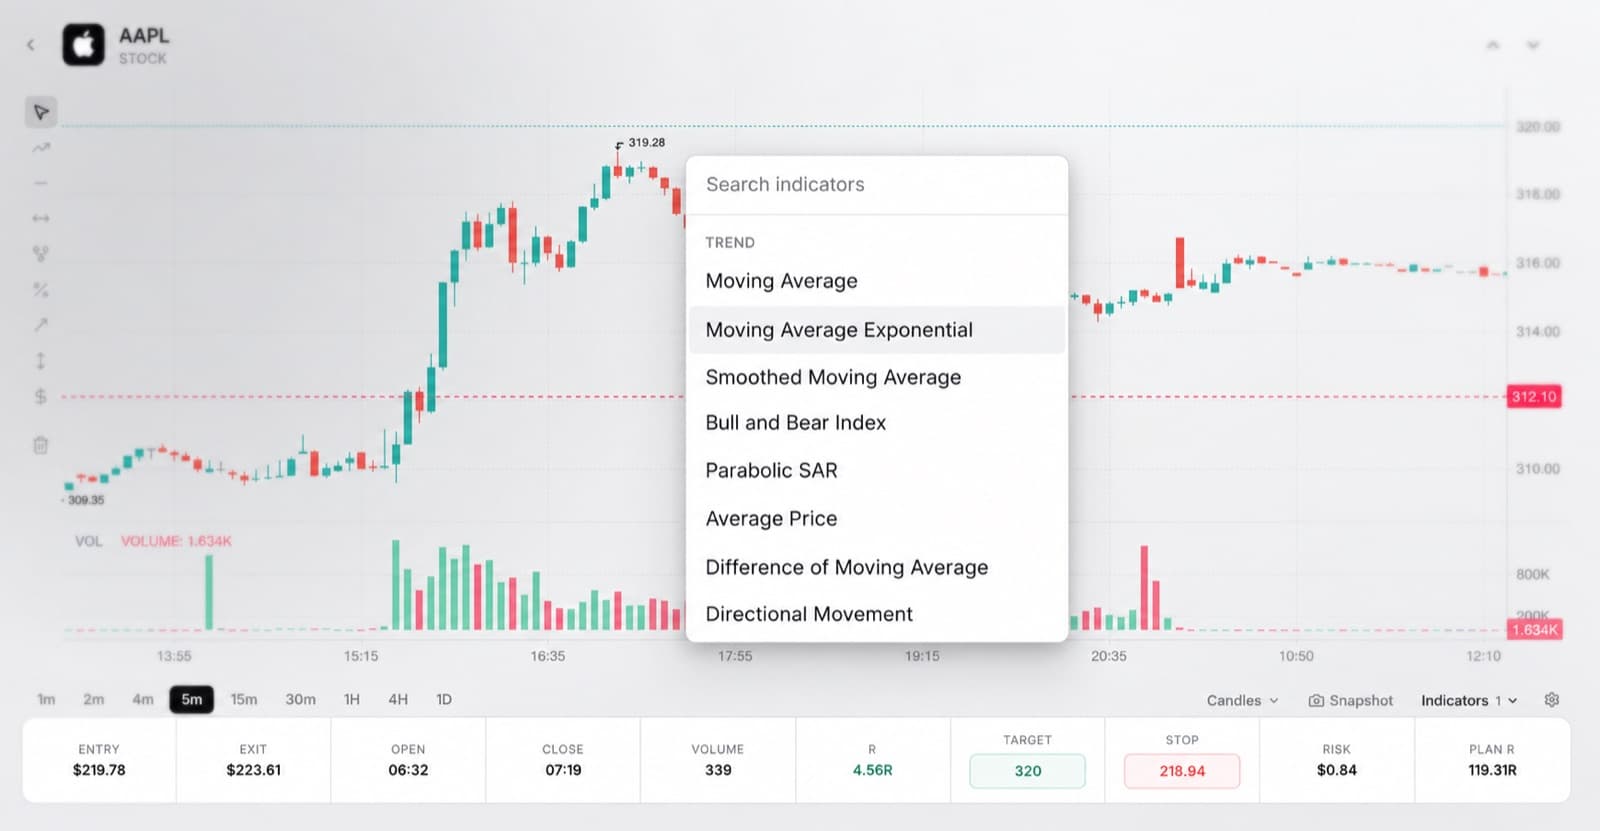
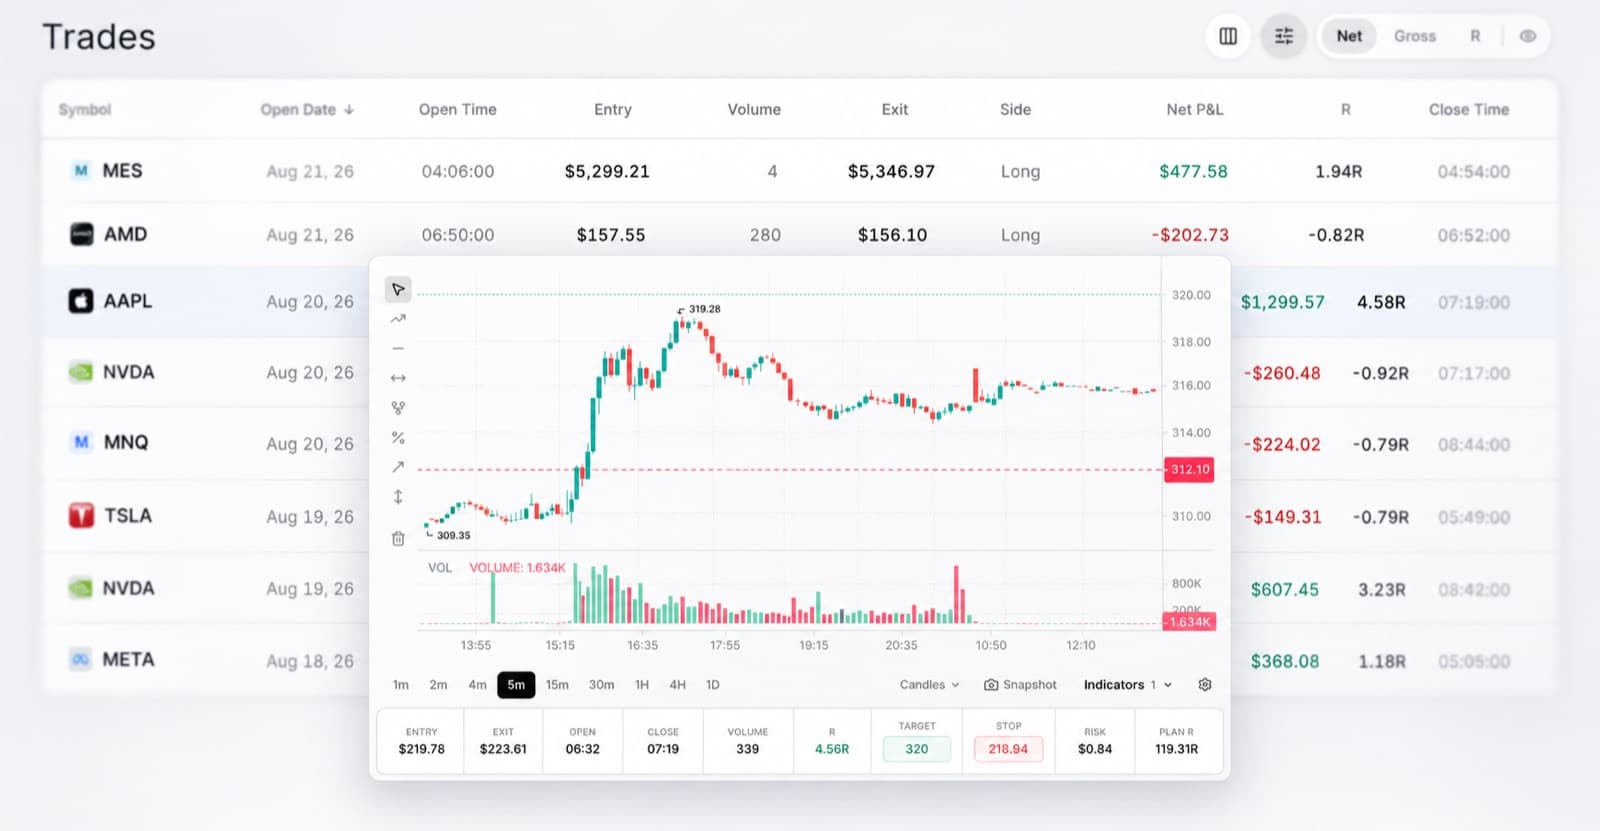
Open a completed trade and review it directly against the historical price chart.
See where you:
- Entered
- Added
- Reduced
- Exited
- Set your stop
- Set your target
This gives you the market context behind the numbers in your trade history.
Review the chart alongside your notes, strategy, emotions and rule compliance to understand how the trade actually developed.
Analyse Your Exit Efficiency
See how well you managed the trade after entry
Getting the direction right is only part of the trade.
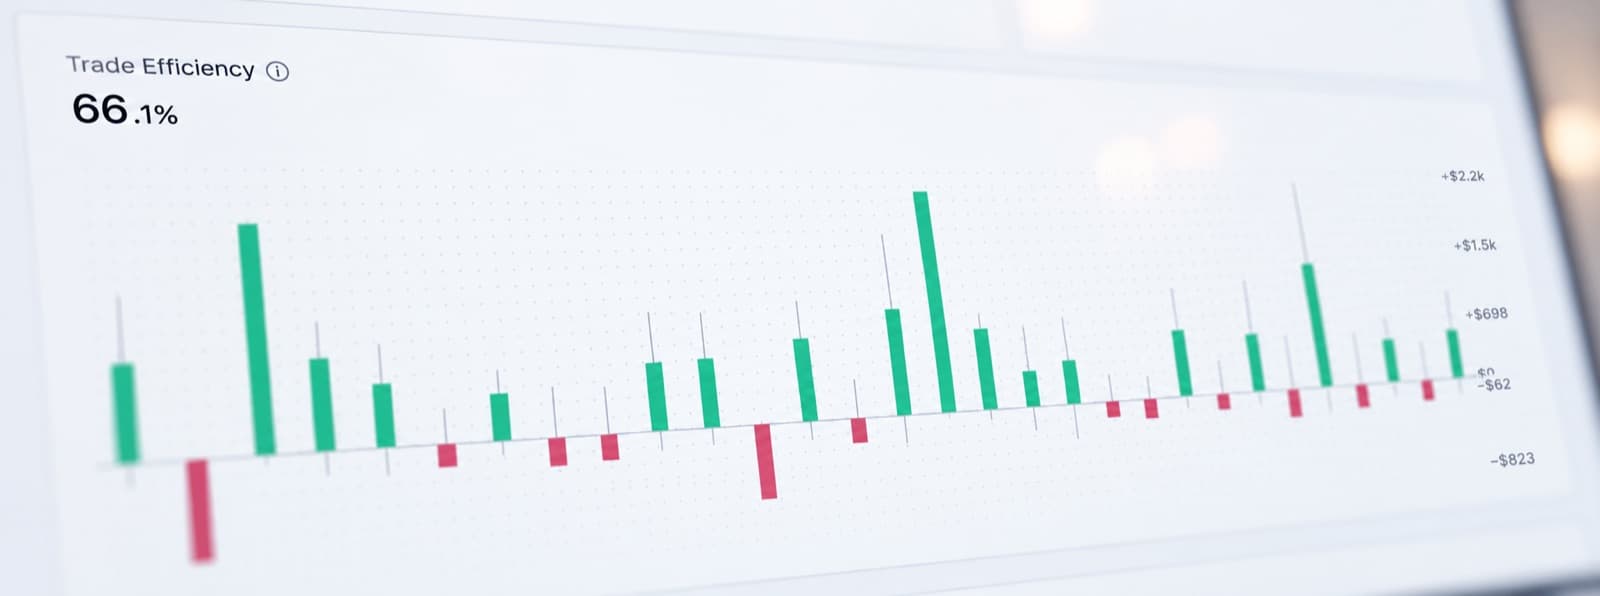
RizeTrade includes execution metrics designed to show how efficiently you managed the position.
Analyse:
- MAE
- MFE
- R-Multiple
- Exit Efficiency Score
- Best Exit Analysis
- Running P&L
- Stop loss
- Profit target
- Drawdown
Use those metrics to identify patterns such as:
- Exiting winners too early
- Letting profits retrace too far
- Using stops that are too wide
- Taking unnecessary partial exits
- Holding losing trades too long
That helps you distinguish an entry problem from a trade management problem.
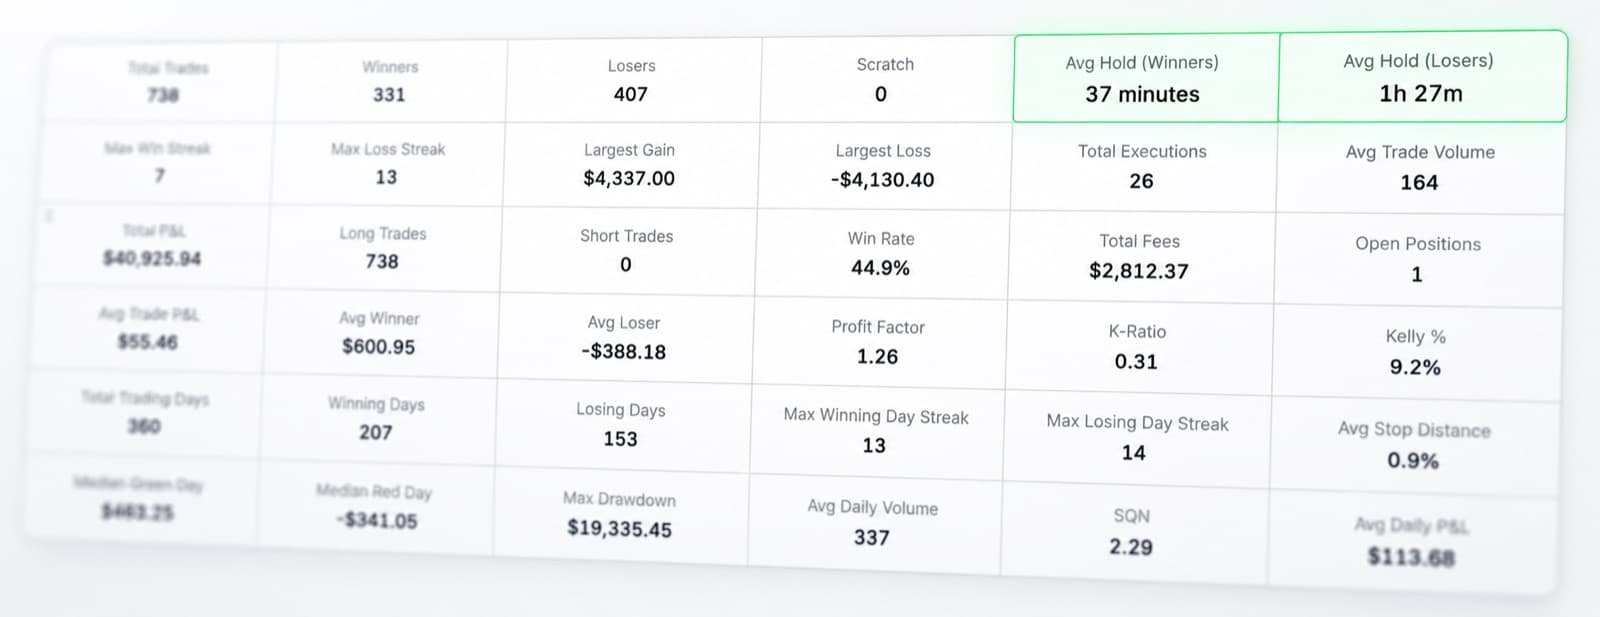
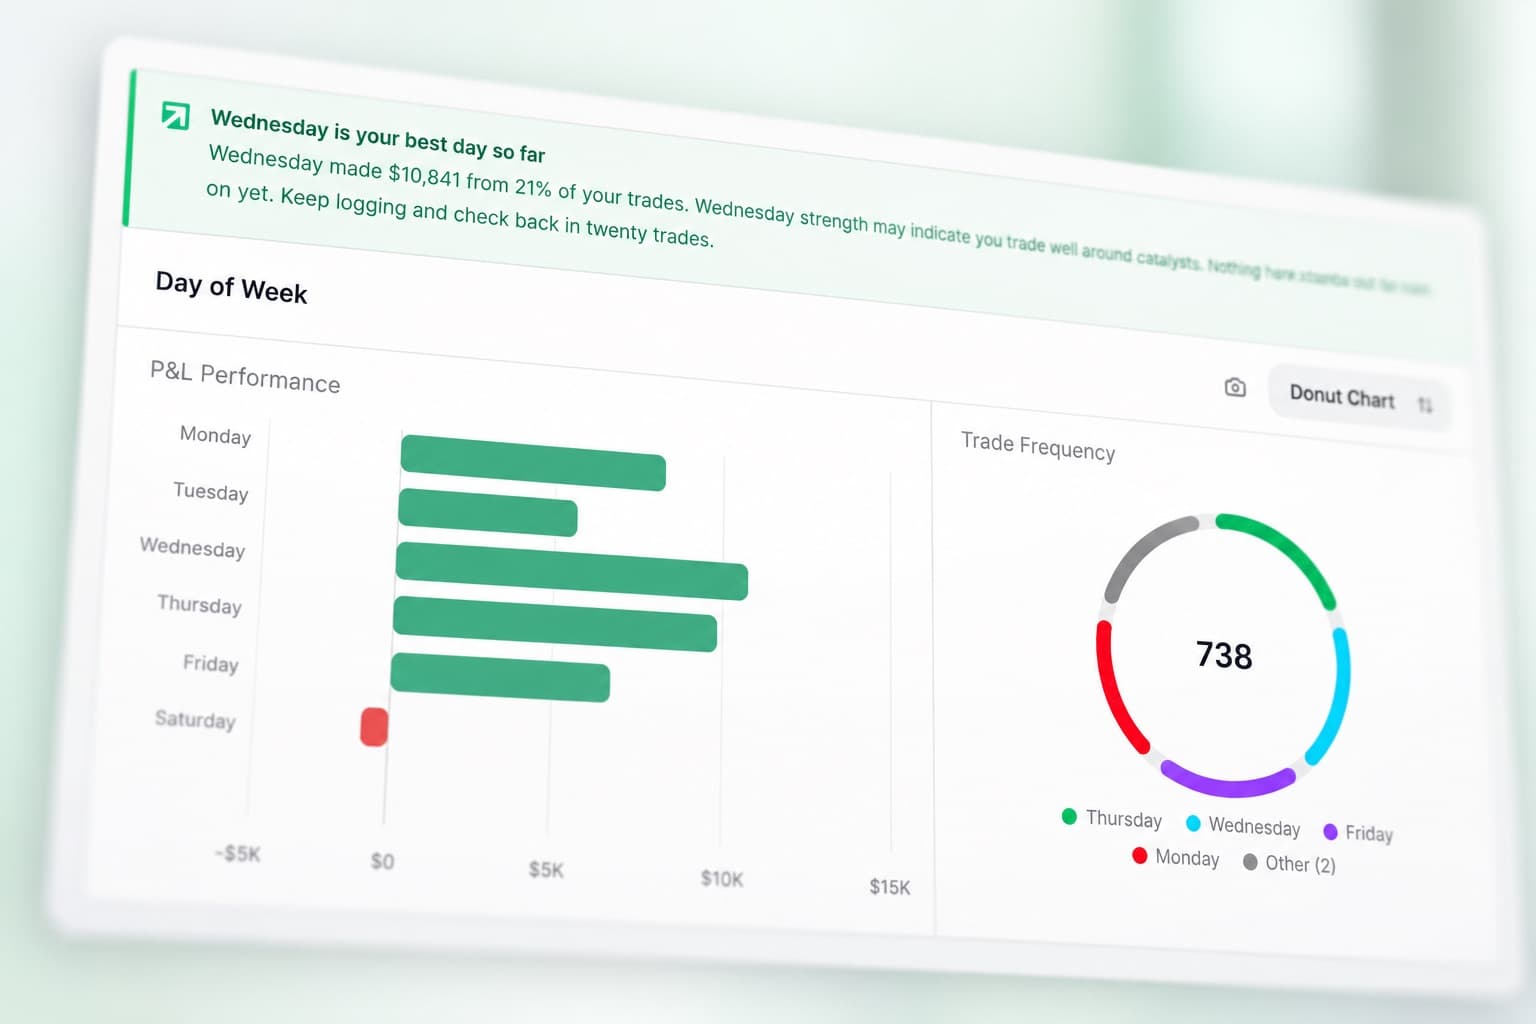
50+ Trading Reports
Automatically analyse your trading history
RizeTrade generates more than 50 reports from your imported trades.
Analyse performance by:
- Date
- Time
- Symbol
- Instrument
- Strategy
- Playbook
- Tags
- Position size
- Risk
- Price
- Quantity
- Trade duration
- Options expiration
- Wins and losses
Stack filters together when you need to investigate a specific part of your trading.
For example:
- How does my breakout playbook perform before 10:00 AM?
- What is my win rate when I follow every strategy rule?
- Which emotions appear most often on trades with poor exit efficiency?
RizeTrade is designed to connect those different parts of your journal rather than treating them as separate datasets.
Ask Trading Mentor AI
Ask questions about your own trading history
Trading Mentor AI gives you another way to analyse the information stored inside RizeTrade.
Ask questions such as:
- “Which rules do I break most frequently?”
- “When do I exit profitable trades too early?”
- “Which strategy performs best when I follow every rule?”
- “What emotions appear most often before my losing trades?”
- “When does my performance start getting worse during the trading day?”
Use AI to investigate your own trade history instead of manually working through every report.

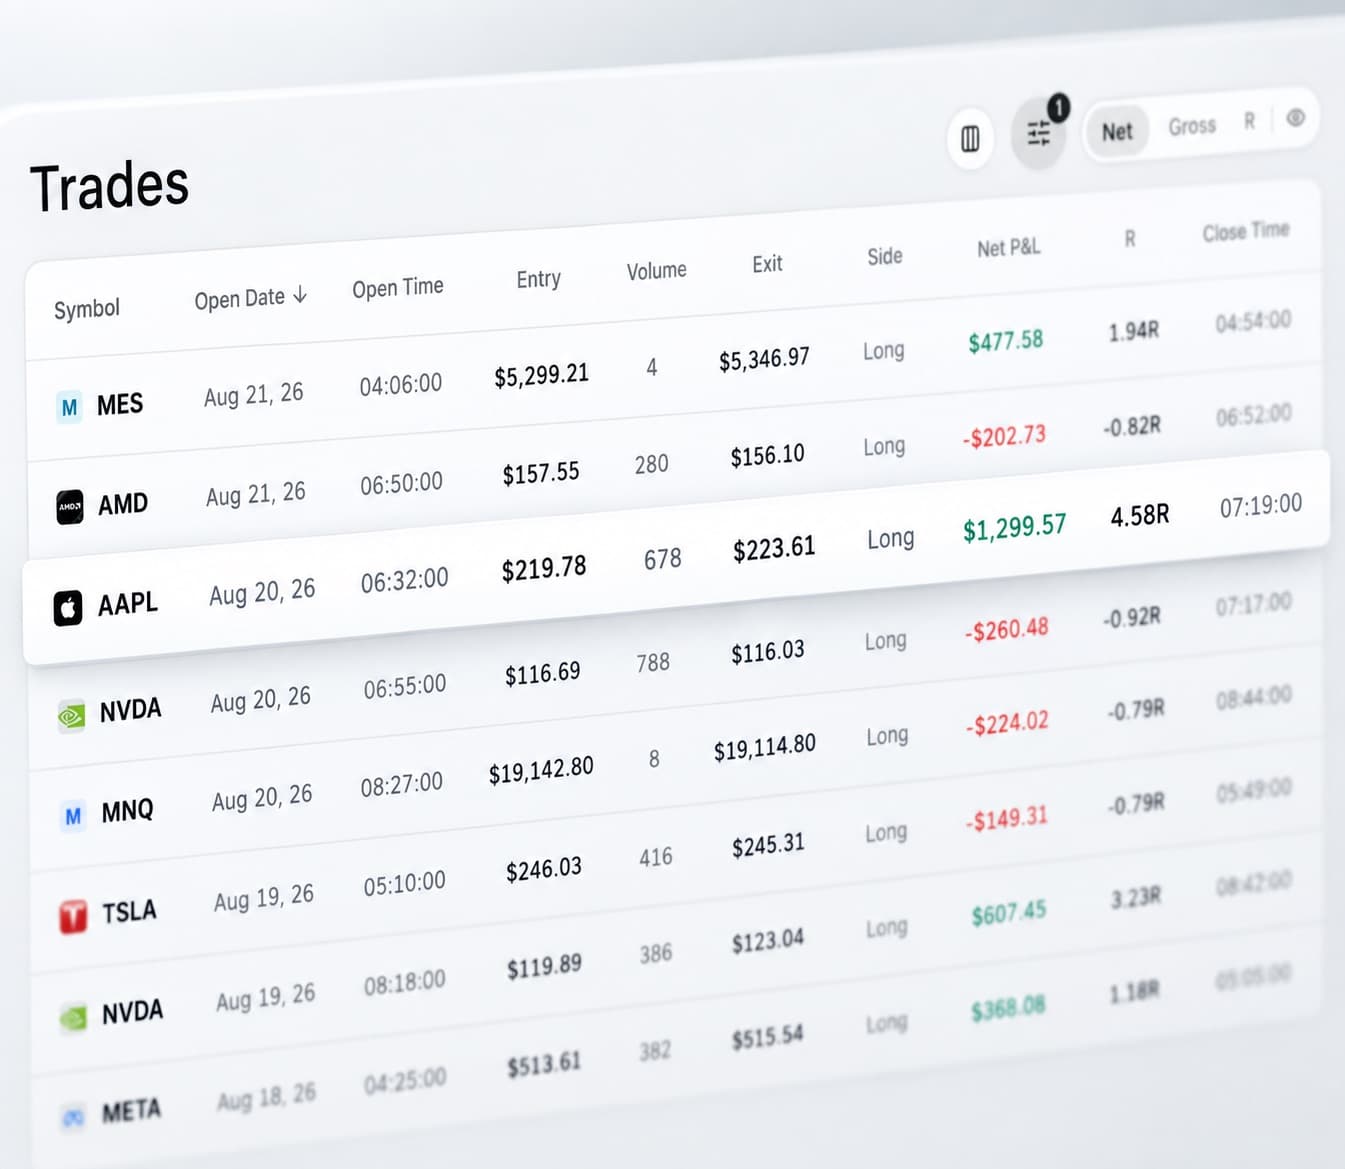
Import Your Trades Automatically
Connect your broker or upload your trade history
RizeTrade supports automatic broker syncing across supported brokers and trading platforms.
You can also:
- Upload trades from a file
- Enter trades manually
- Import previous trading history
- Track multiple accounts
- Track commissions and fees
- Use multiple currencies
Once imported, those trades become available across your journal, charts, reports, calendar and discipline tools.
P&L Calendar
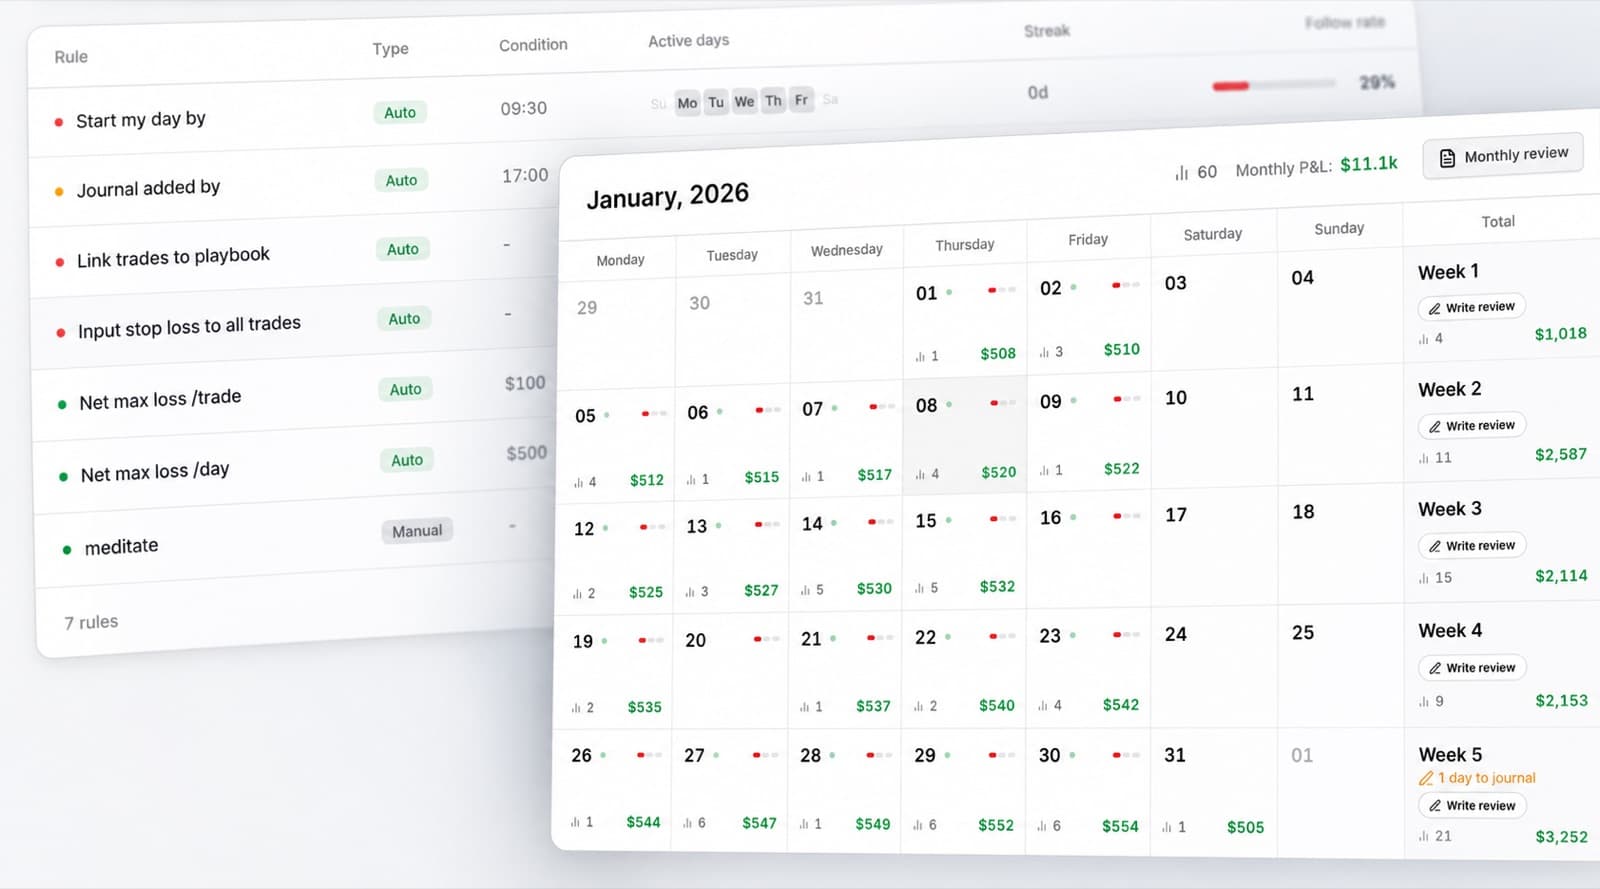
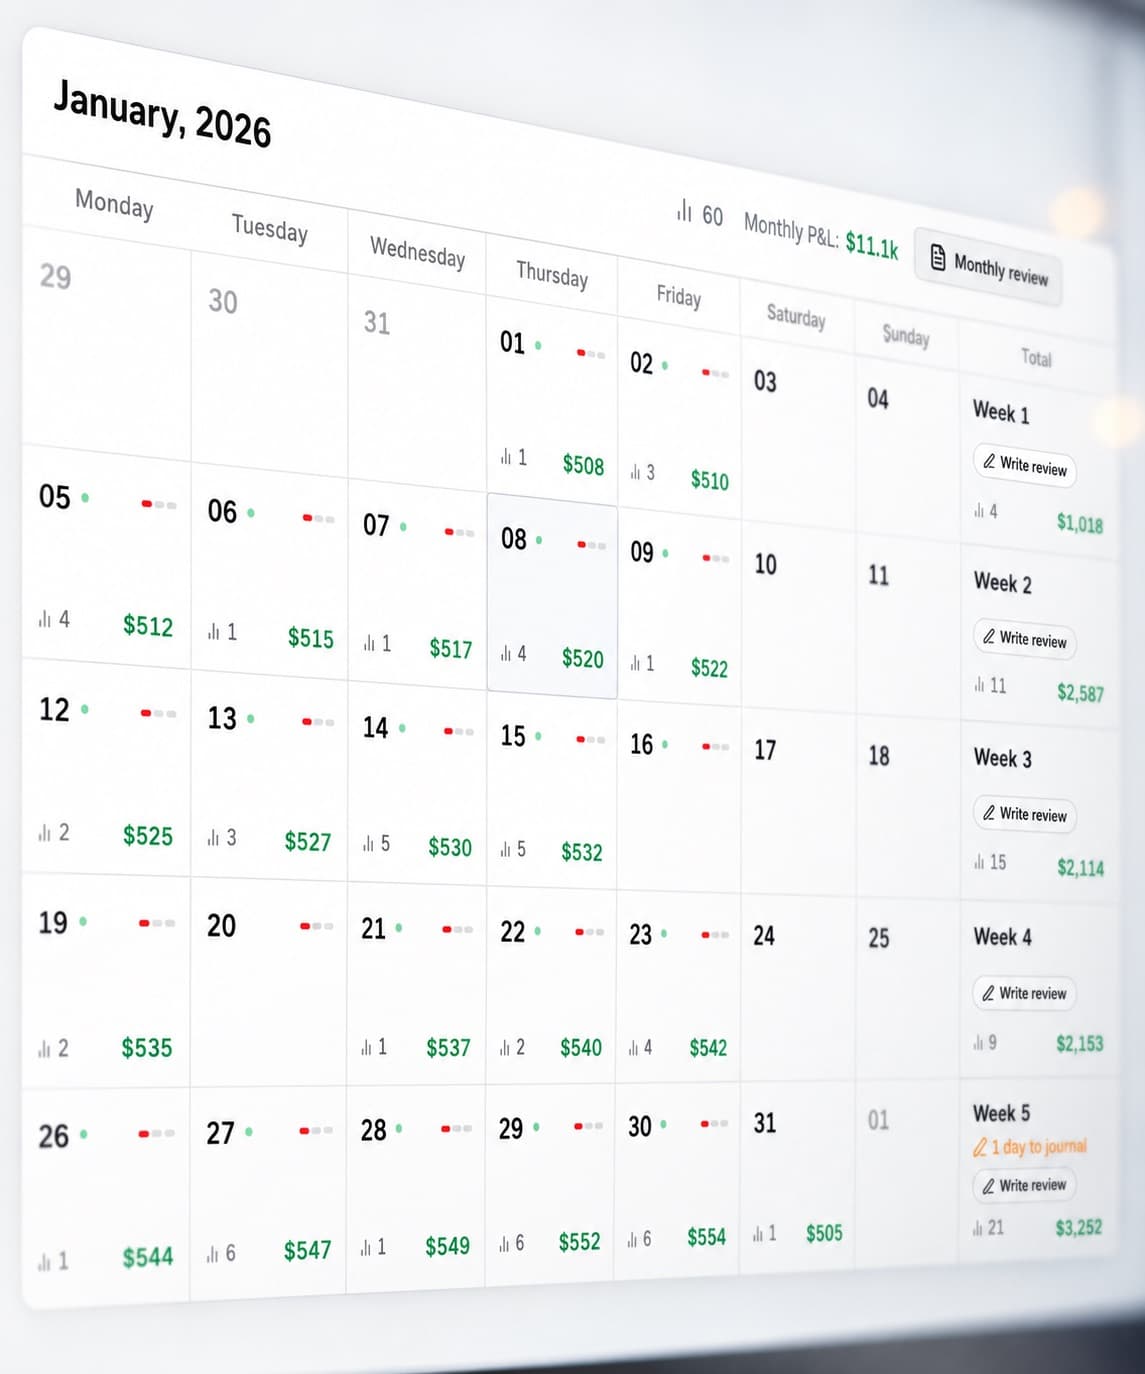
See your trading performance across the month
View your daily results on a calendar.
Quickly identify:
- Profitable days
- Losing days
- Winning streaks
- Losing streaks
- High-volume days
- Periods of inconsistent trading
Open a particular day when you want to review the trades behind the result.
The calendar gives you a simple overview before you move into more detailed analysis.
Where Chartlog Is Stronger
Chartlog is a solid choice if charting and detailed custom analytics are the main things you want from a trading journal.
Its current feature set includes:
- Dynamic charts
- Drawing tools
- Indicators and studies
- Pre-market and post-market data
- More than 15 years of historical market data
- Strategy sample sets
- Performance forecasting
- Advanced insights reports
- Custom dashboards
- Custom reports
Chartlog also includes unlimited trades and unlimited trading accounts across its paid plans.
If those features are central to your workflow, Chartlog may be the better fit.
Where RizeTrade Makes More Sense
Choose RizeTrade if you want to improve how you trade
RizeTrade is built for traders asking questions such as:
- Am I actually following my strategy?
- Which rules do I keep breaking?
- Which emotions affect my execution?
- Am I managing my winners efficiently?
- What happens when my discipline drops?
- Do my best results come from my best-executed trades?
RizeTrade connects those behavioural questions with your trading data.
Instead of only showing you what performed well, it helps you investigate what you did differently when you traded well.
Free Chartlog Alternative
RizeTrade
RizeTrade
Free
Includes
- Discipline Tracker
- Consistency Tracker with Heat Map
- P&L Calendar
- Emotion tracking
- Strategy tracking
- Strategy playbooks
- Playbook Compliance Score
- Progress Tracker
- Daily journal
- Historical trade charts
- MAE & MFE
- Best Exit Analysis
- Exit Efficiency Score
- 50+ reports
- Broker sync
- File imports
- Manual trade entry
- Unlimited trading accounts
Trading Mentor AI
$29/month
Adds an AI mentor that reads your trades. Everything else is free.
Start freeChartlog
Chartlog Lite
$14.99/month
Includes
- Unlimited trades
- Unlimited trading accounts
- Trading journal
- Calendar
- Tags
- Charts
- Drawing tools
- Indicators and studies
- Risk/reward calculation
- MAE and MFE
Chartlog Standard
$29.99/month
Adds
- Strategy tracking
- Strategy analysis
- Rules and rule groups
- Sample sets
- Performance forecasting
- Basic Insights reports
Chartlog Pro
$39.99/month
Adds
- Advanced Insights reports
- Custom dashboards
- Custom reports
RizeTrade's value proposition is not being the cheapest trading journal. It is giving traders a broader set of dedicated tools for analysing discipline, behaviour and execution in the same journal.
Chartlog Alternative FAQs
- Is RizeTrade a Chartlog alternative?
Yes.
Both platforms let you import trades, journal your activity, review trades on charts and analyse performance.
RizeTrade adds dedicated tools for tracking discipline, emotions, playbook compliance and trade execution.
- Is RizeTrade cheaper than Chartlog?
RizeTrade is free, and includes its discipline, playbook and behavioural tracking features.
- Does RizeTrade track trading discipline?
Yes.
RizeTrade includes a Discipline Tracker, Progress Tracker and playbook rule scoring to help traders measure whether they followed their process.
- Does RizeTrade track emotions?
Yes.
Emotions can be recorded against trades and analysed alongside your performance data.
- Can RizeTrade analyse MAE and MFE?
Yes.
RizeTrade includes MAE and MFE statistics alongside Best Exit Analysis and an Exit Efficiency Score.
- Does RizeTrade have AI?
Yes.
Trading Mentor AI lets you ask questions about your trading history, behaviours and performance.
- Does Chartlog have better charting?
Chartlog has a strong dedicated charting feature set that includes drawing tools, indicators, studies, pre/post-market data and historical market data.
If advanced charting inside your journal is your main priority, Chartlog may be the better choice.
- Can I import my existing trades into RizeTrade?
Yes.
You can connect a supported broker, upload your trading history from a file or enter trades manually.
Try RizeTrade as Your Chartlog Alternative
Your journal should show you more than your P&L.
RizeTrade connects your trading results with your strategies, rules, discipline, emotions and execution so you can understand why your performance changes.
Import your trades and start reviewing the process behind the result.