

Looking for an alternative?
TradesViz Alternative
Get the trading insights you need without the clutter.
TradesViz packs hundreds of statistics, charts, widgets, simulators and analytics tools into one trading platform.
For some traders, that's exactly what they want.
For others, it can feel like too much.
RizeTrade takes a simpler approach: import your trades, see what happened, identify what went wrong and know what to work on next.
A clean trading journal built around your trades, discipline, strategies and execution.
Try RizeTrade Free100% FreeNo CC Required
4.8/5 1,794 Reviews


A Cleaner Alternative to TradesViz
Your trading journal shouldn't take weeks to learn
TradesViz is built for depth.
Its interface gives traders access to hundreds of statistics, configurable dashboards, grids, charts, simulators and analysis tools.
That flexibility comes with a trade-off.
There is more information on screen, more configuration and more places to look when you simply want to answer:
- How did I trade today?
- Did I follow my rules?
- Where did I make mistakes?
- What should I do differently tomorrow?
RizeTrade is designed around those questions.
The interface is cleaner, the workflow is more focused and the important information is easier to find.
- Import
- Review
- Improve
Without digging through hundreds of metrics first.
RizeTrade vs TradesViz
Both RizeTrade and TradesViz can import your trades, journal your activity and analyse your trading performance.
The difference is the experience each product is designed to provide.
| Feature | RizeTrade | TradesViz |
|---|---|---|
| Automatic Trade Import | Yes | Yes |
| CSV / File Import | Yes | Yes |
| Manual Trade Entry | Yes | Yes |
| Trading Journal | Yes | Yes |
| Historical Trade Charts | Yes | Yes |
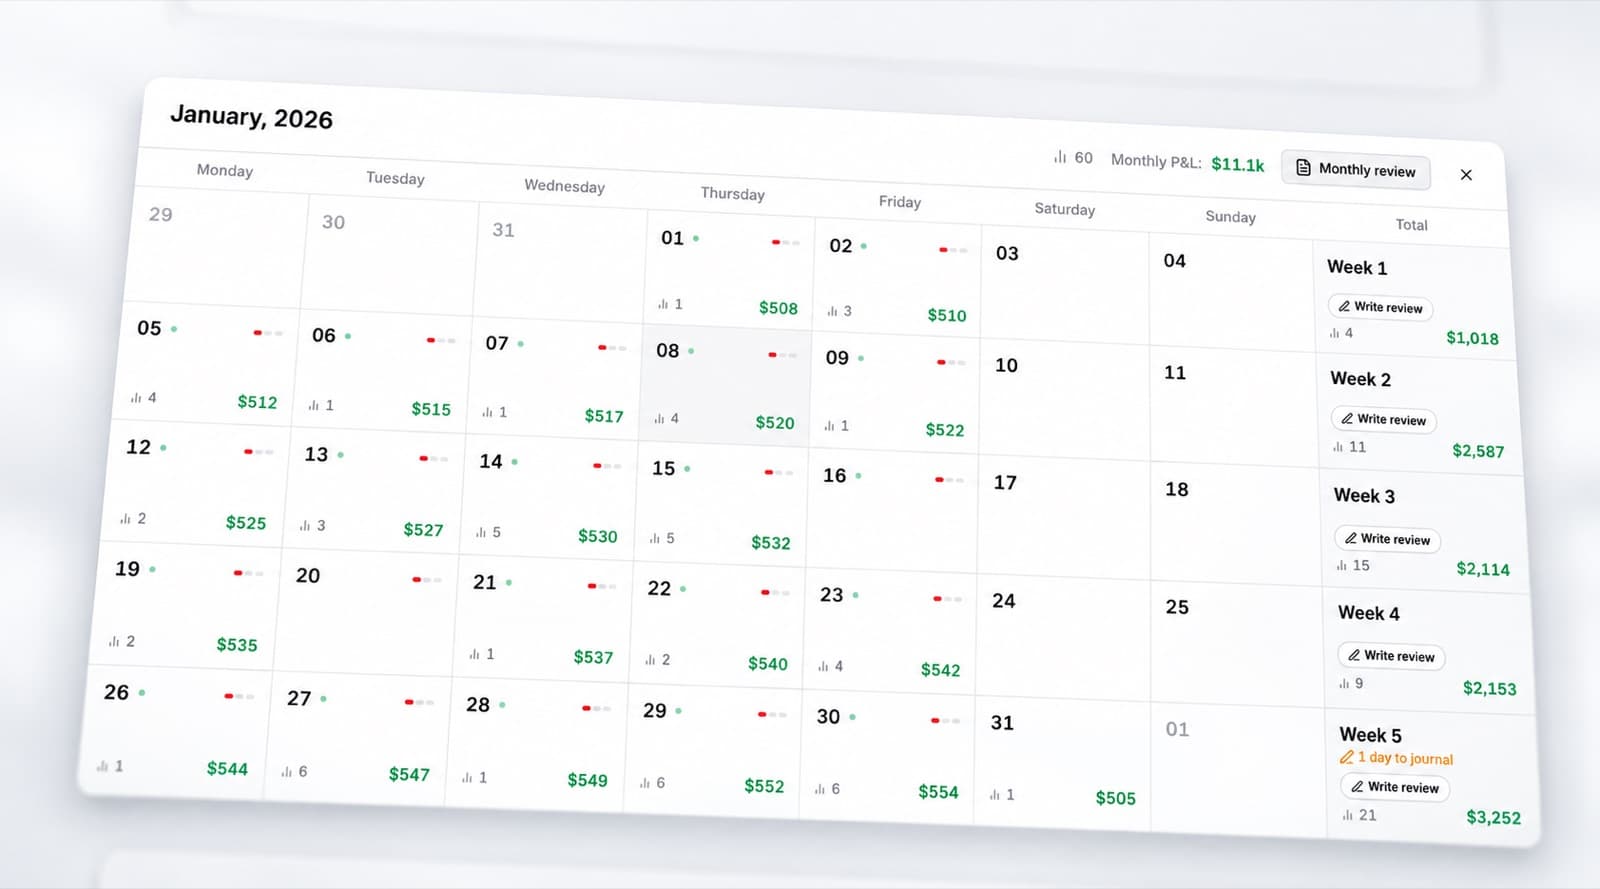
| P&L Calendar | Yes | Yes |
| Strategy Analysis | Yes | Yes |
| MAE & MFE | Yes | Yes |
| Custom Tags | Yes | Yes |
| AI Analysis | Trading Mentor AI | AI Suite |
| Discipline Tracker | Yes | Checklist / mistake tools |
| Emotion Tracking | Yes | Mistake / journal tools |
| Strategy Playbooks | Yes | Plans & checklists |
| Playbook Compliance Score | Yes | No |
| Consistency Heat Map | Yes | No |
| Trade Grade | Yes | No |
| Exit Efficiency Score | Yes | Exit analytics |
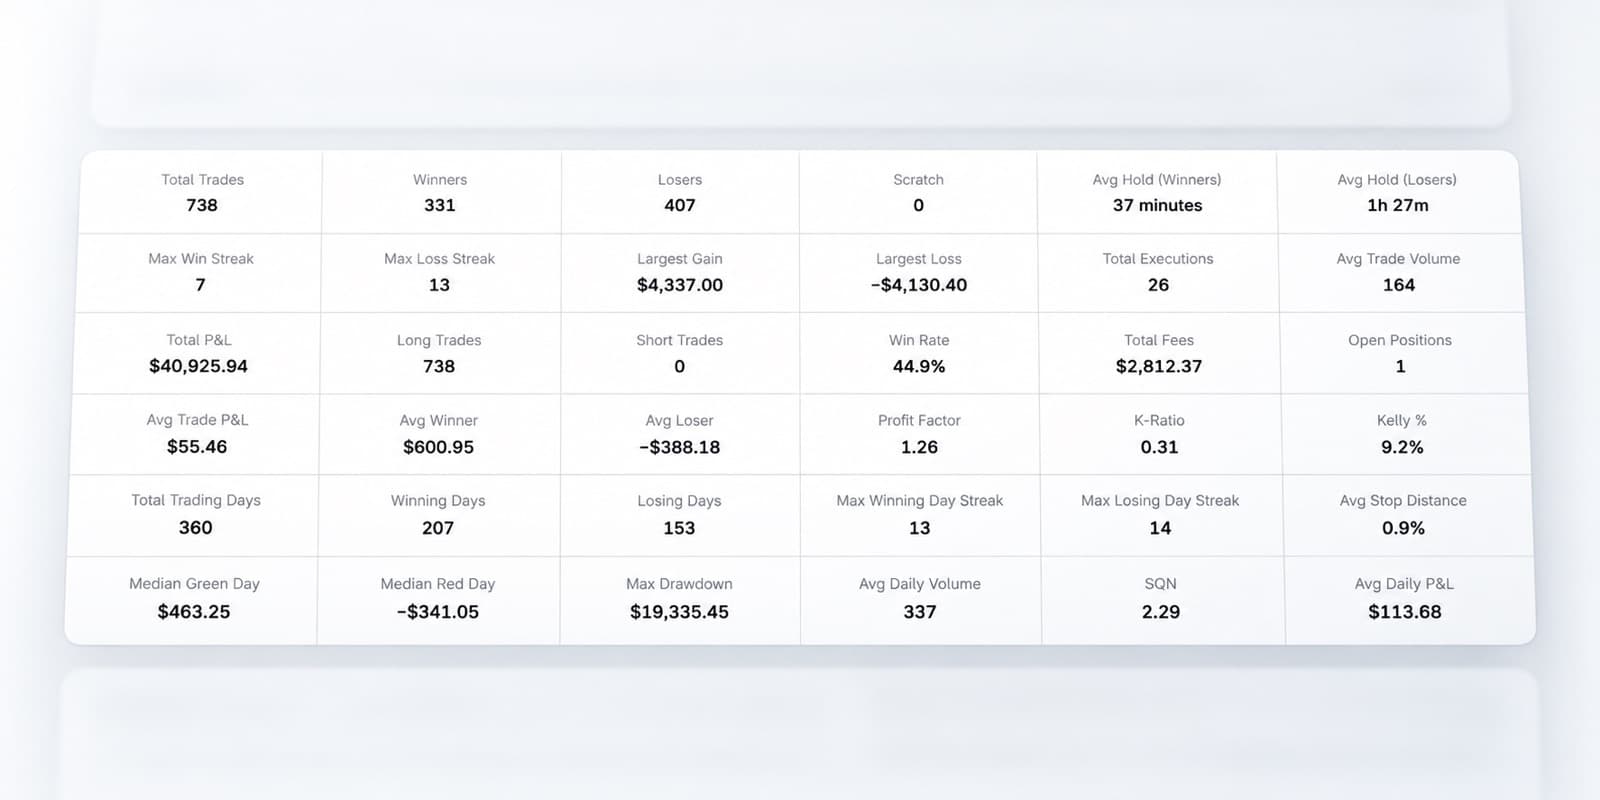
| Auto-Generated Reports | 50+ | 600+ stats |
| Highly Customisable Dashboards | Focused views | Yes |
| Trading Simulator | No | Yes |
| Backtesting | No | Yes |
| Options Flow Tools | No | Yes |
| Free Plan | Yes | Yes |
Choose RizeTrade if you want a clear journal that tells you where your trading process is breaking down.
Choose TradesViz if you want maximum analytical depth, customisation, simulation and reporting.
Less Dashboard. More Answer.
RizeTrade is designed to make your trading data easier to understand
More data does not automatically create better decisions.
You can have hundreds of charts available and still not know which three things you need to improve.
RizeTrade intentionally keeps the review workflow focused.
Open your journal and quickly get to:
- Your trades
- Daily P&L
- Strategy performance
- Rules followed
- Rules broken
- Discipline
- Emotions
- Trade grades
- MAE and MFE
- Exit efficiency
- Reports
You spend less time deciding where to look and more time reviewing what actually happened.
A Modern, Clear Trading Journal UI
Your journal should make the important information obvious
A trading journal is something you potentially open every day.
If every screen is packed with tables, buttons, filters, charts and configuration options, reviewing your trades can start to feel like work.
RizeTrade is designed around a simpler visual hierarchy.
Key statistics are easy to scan.
Charts are given room to breathe.
Trading behaviour is separated into clear sections.
Reports answer specific questions rather than surrounding you with every possible metric at once.
The result is a journal that feels easier to navigate when you just finished a trading session and want to understand what happened.
No Need to Build the Perfect Dashboard First
RizeTrade does the organising for you
TradesViz gives traders extensive dashboard customisation.
That is useful if you know exactly which metrics, widgets and layouts you want.
RizeTrade takes a different approach.
Your trading data is automatically organised into predefined views and reports designed around common review questions.
Want to know your best trading time?
Open the relevant report.
Want to see which strategy performs best?
Open Strategy Performance.
Want to see whether breaking your rules hurts your results?
Open your playbook and discipline data.
You don't need to design the analytics system before you can use it.
Track Your Trading Discipline
See whether you actually followed your plan
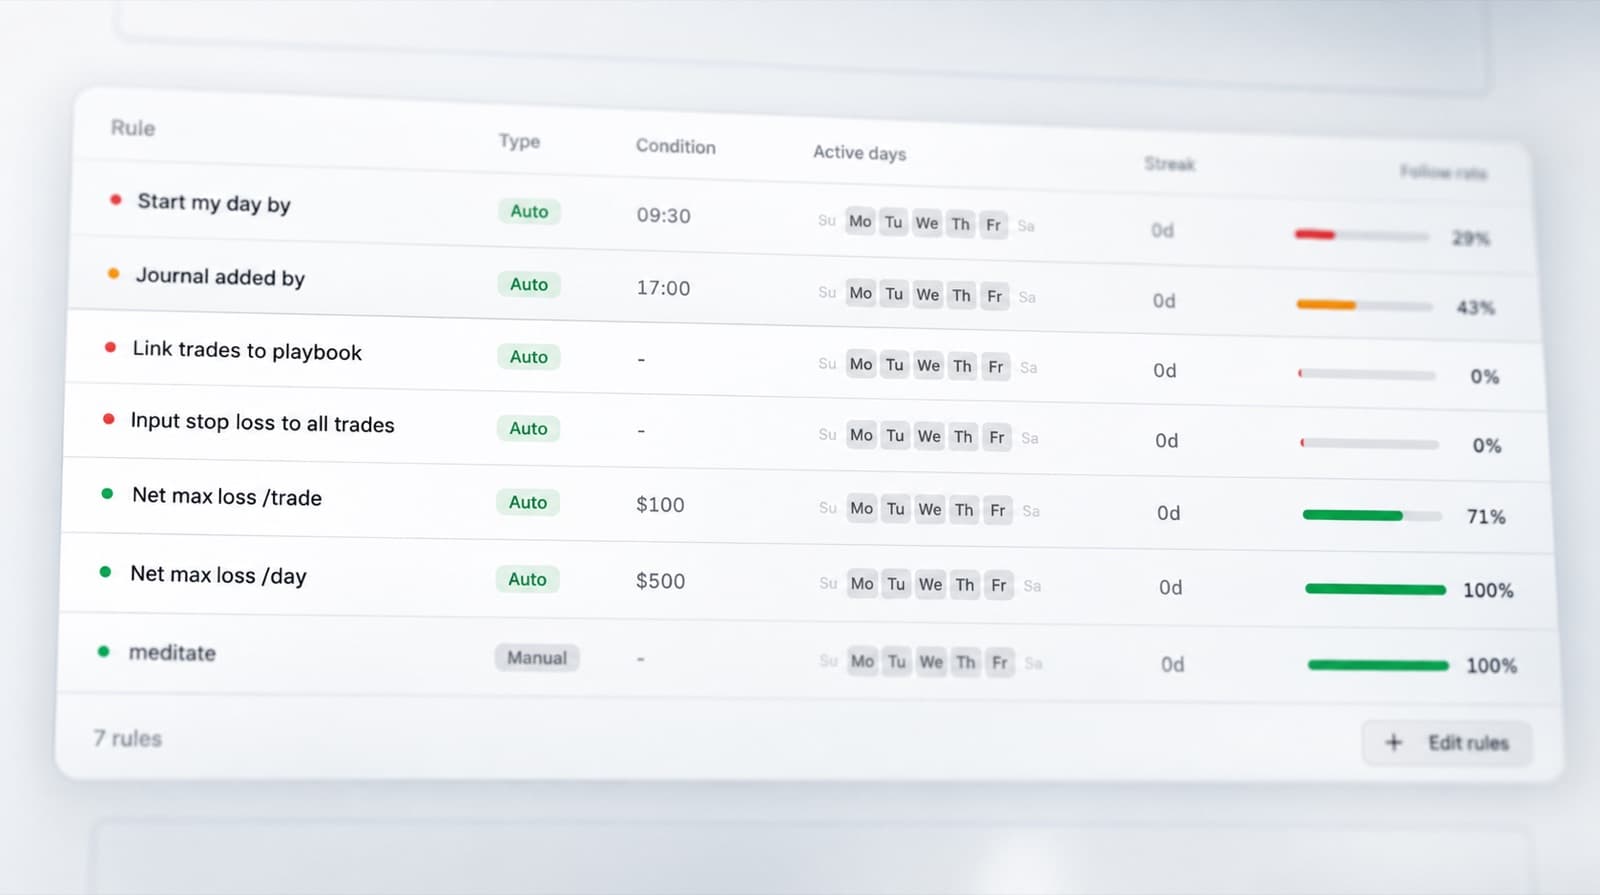
RizeTrade treats discipline as a core part of your trading data.
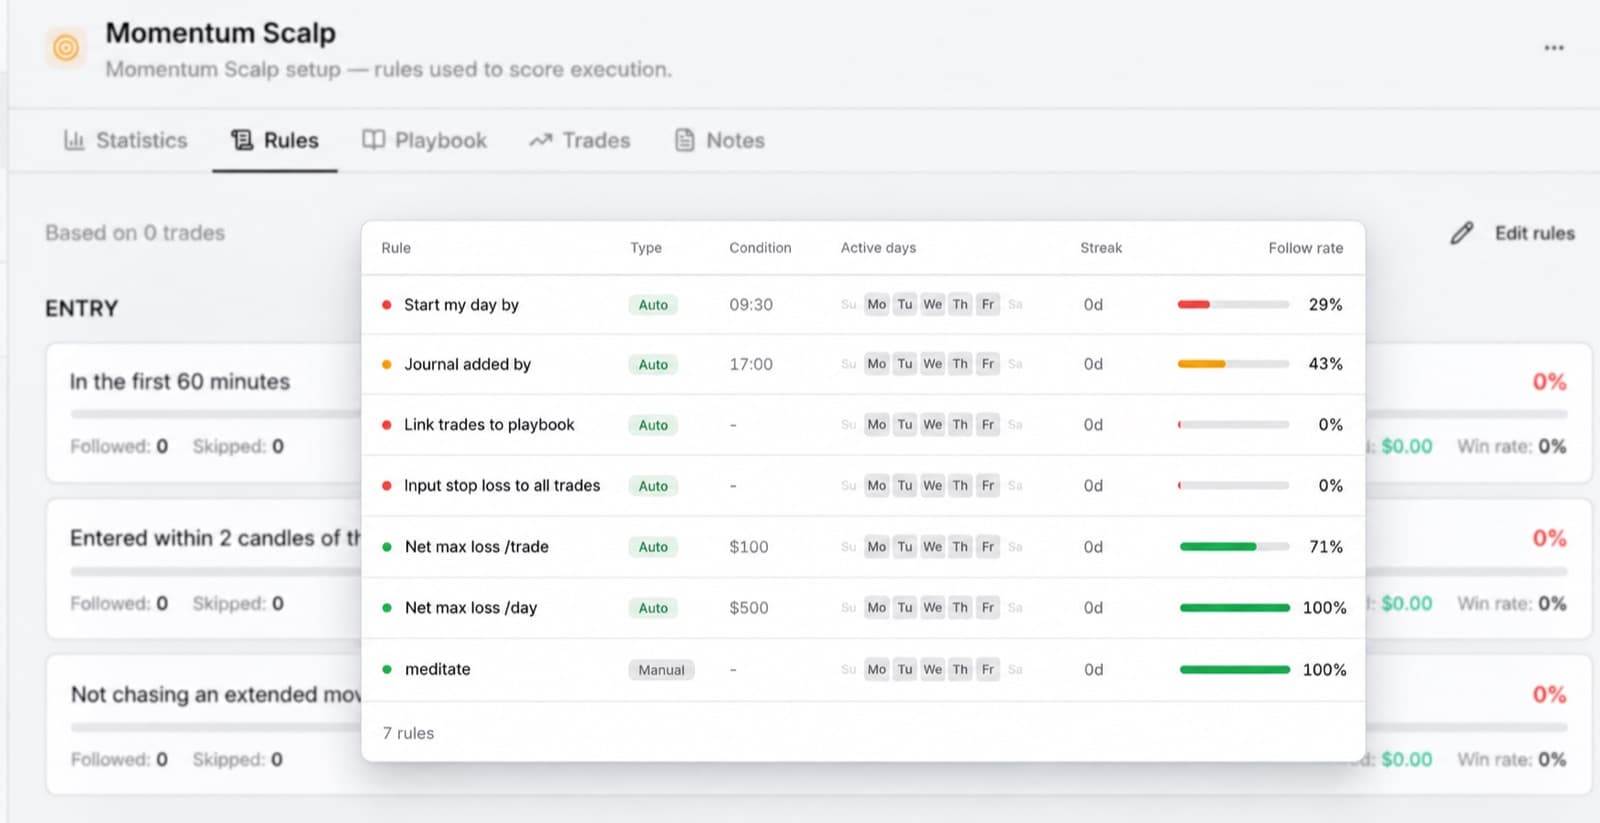
Create the rules you want to follow and record whether you followed them.
Track things such as:
- Maximum daily loss
- Maximum number of trades
- Risk limits
- Trading hours
- Entry rules
- Stop rules
- Setup requirements
- Daily preparation
- Post-trade review
Then see where your process starts breaking down.
Instead of looking at another P&L chart and wondering what changed, you can compare your results with your actual trading behaviour.
Strategy Playbooks
Define what a good trade is before you analyse the result
Create a playbook for each strategy you trade.
Add the rules that define a valid setup.
For example:
- Market conditions
- Entry criteria
- Confirmation
- Stop placement
- Risk
- Trade management
- Exit criteria
Then record which rules were followed on each trade.
RizeTrade calculates a Playbook Compliance Score so you can see how closely your actual execution matched the setup you intended to trade.
That makes it easier to answer:
- Is the strategy bad, or am I trading a good strategy badly?
See Your Consistency
Track your process across days, not just individual trades
RizeTrade's Progress Tracker and consistency heat map give you a visual record of whether you followed your process.
You can quickly see periods where discipline was strong and periods where your rules started slipping.
That gives you another measurement of improvement beyond P&L.
Because sometimes a profitable week contains terrible trading.
And sometimes a losing week contains some of your best execution.
Track Your Emotions
Connect your psychology with the trade
Record what you were feeling when you traded.
Track emotions and behaviours such as:
- FOMO
- Revenge trading
- Fear
- Frustration
- Overconfidence
- Boredom
- Hesitation
Then compare those trades with the rest of your history.
Maybe your win rate drops when you're frustrated.
Maybe FOMO trades have worse entry efficiency.
Maybe your biggest losses happen after you start revenge trading.
RizeTrade makes those patterns easier to isolate instead of leaving them buried in journal notes.
Grade the Trade, Not Just the Result
A green trade can still be a bad trade
A profitable trade does not automatically mean you made a good decision.
And a stopped-out trade does not automatically mean you made a bad one.
Use Trade Grade to record how well you executed the trade separately from its P&L.
That helps you identify the decisions worth repeating instead of accidentally reinforcing bad behaviour because it happened to make money.
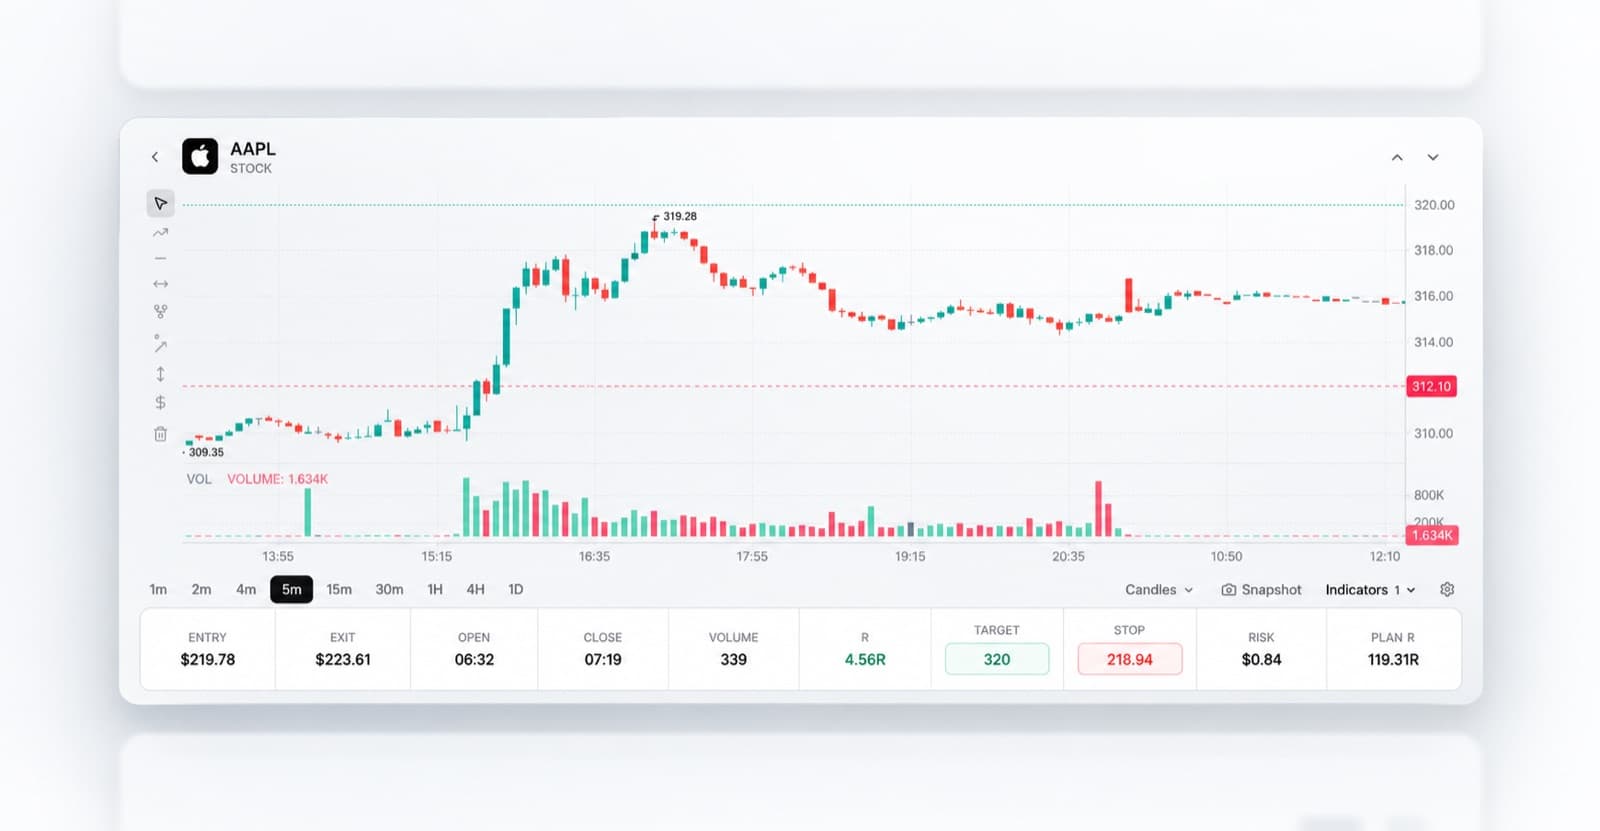
Review Your Trades on a Clear Historical Chart
See exactly what happened after you entered
Open any completed trade and see your executions plotted against the historical price chart.
Review where you:
- Entered
- Added
- Reduced
- Exited
- Set your stop
- Set your target
The chart gives you the context behind the execution prices.
Use it alongside your strategy, notes, emotions and rule compliance to review how the trade actually developed.
Analyse Your Trading Efficiency
See whether you managed the trade well
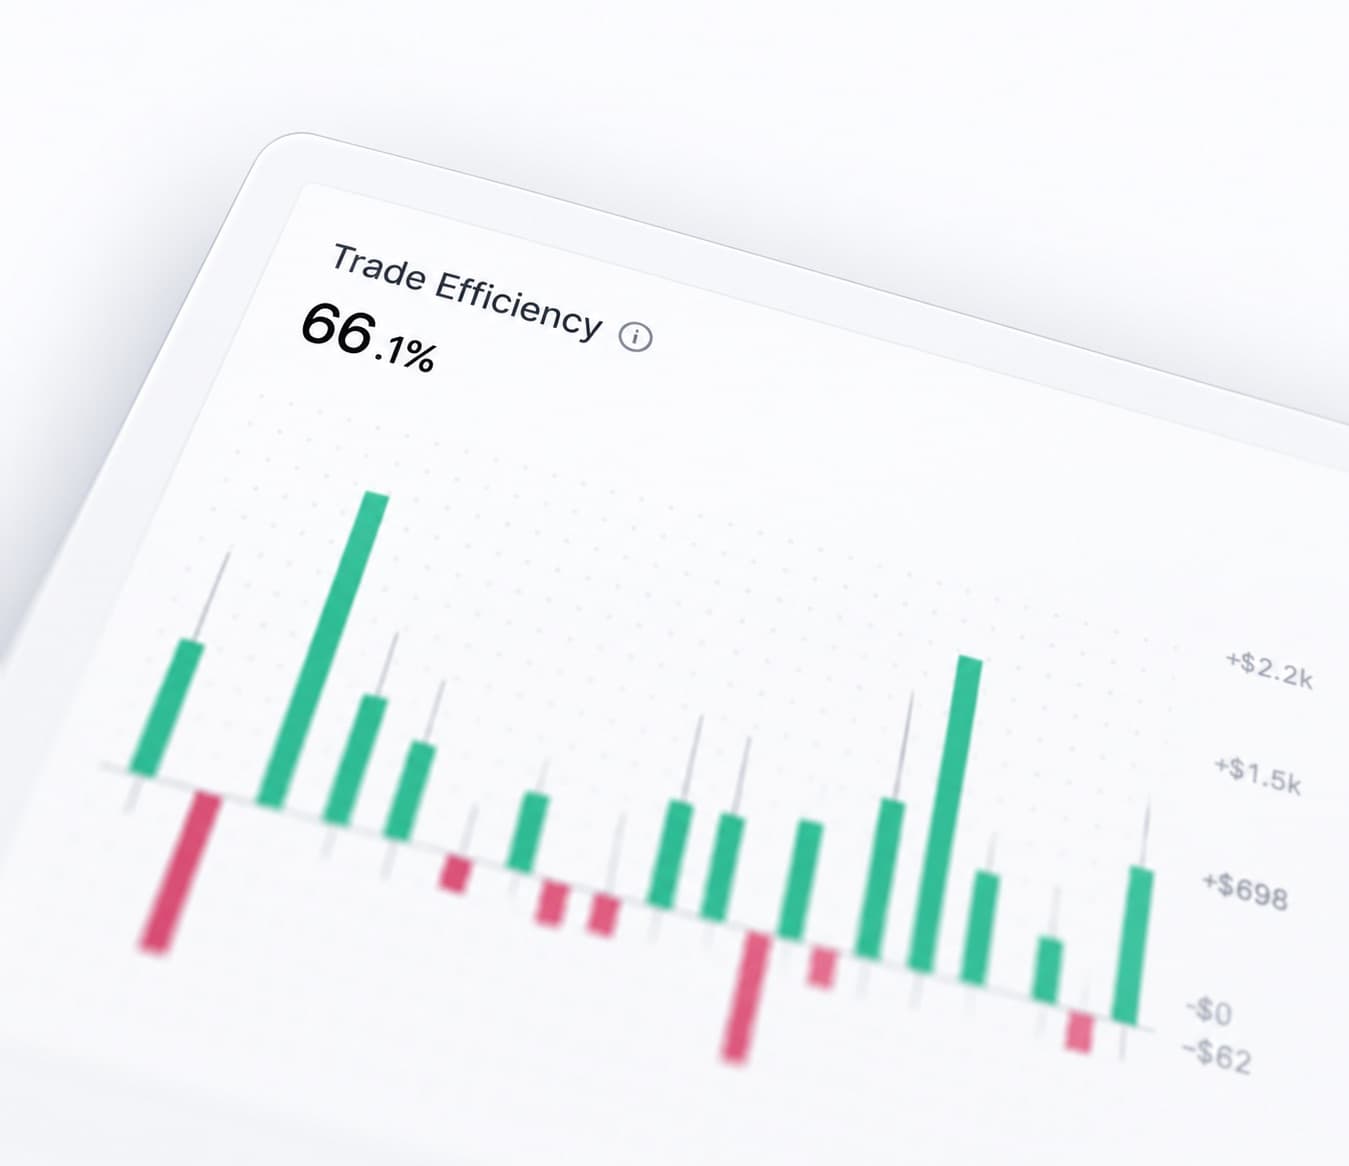
RizeTrade gives you specific execution metrics instead of requiring you to find them amongst hundreds of available statistics.
Review:
- MAE
- MFE
- R-Multiple
- Best Exit Analysis
- Exit Efficiency Score
- Stops
- Take profits
- Running P&L
- Drawdown
See whether you repeatedly:
- Exit winners too early
- Give back too much open profit
- Hold losers too long
- Use inefficient stops
- Manage good entries poorly
This makes it easier to work out whether your problem is finding trades or managing them.
50+ Reports Without 600 Things to Look At
Enough data to find the pattern without drowning in it
TradesViz's analytical depth is impressive.
It currently advertises hundreds of statistics and visualisations.
RizeTrade deliberately takes a narrower approach.
50+
RizeTrade reports, generated automatically
600+
TradesViz statistics
You get more than 50 automatically generated reports covering things such as:
- Date
- Time
- Symbol
- Instrument
- Strategy
- Playbook
- Tags
- Risk
- Position size
- Price
- Quantity
- Trade duration
- Wins and losses
You can stack filters when you need to investigate something more specific.
The difference is that RizeTrade is designed to help you get to the answer quickly rather than exposing every possible analysis tool at once.
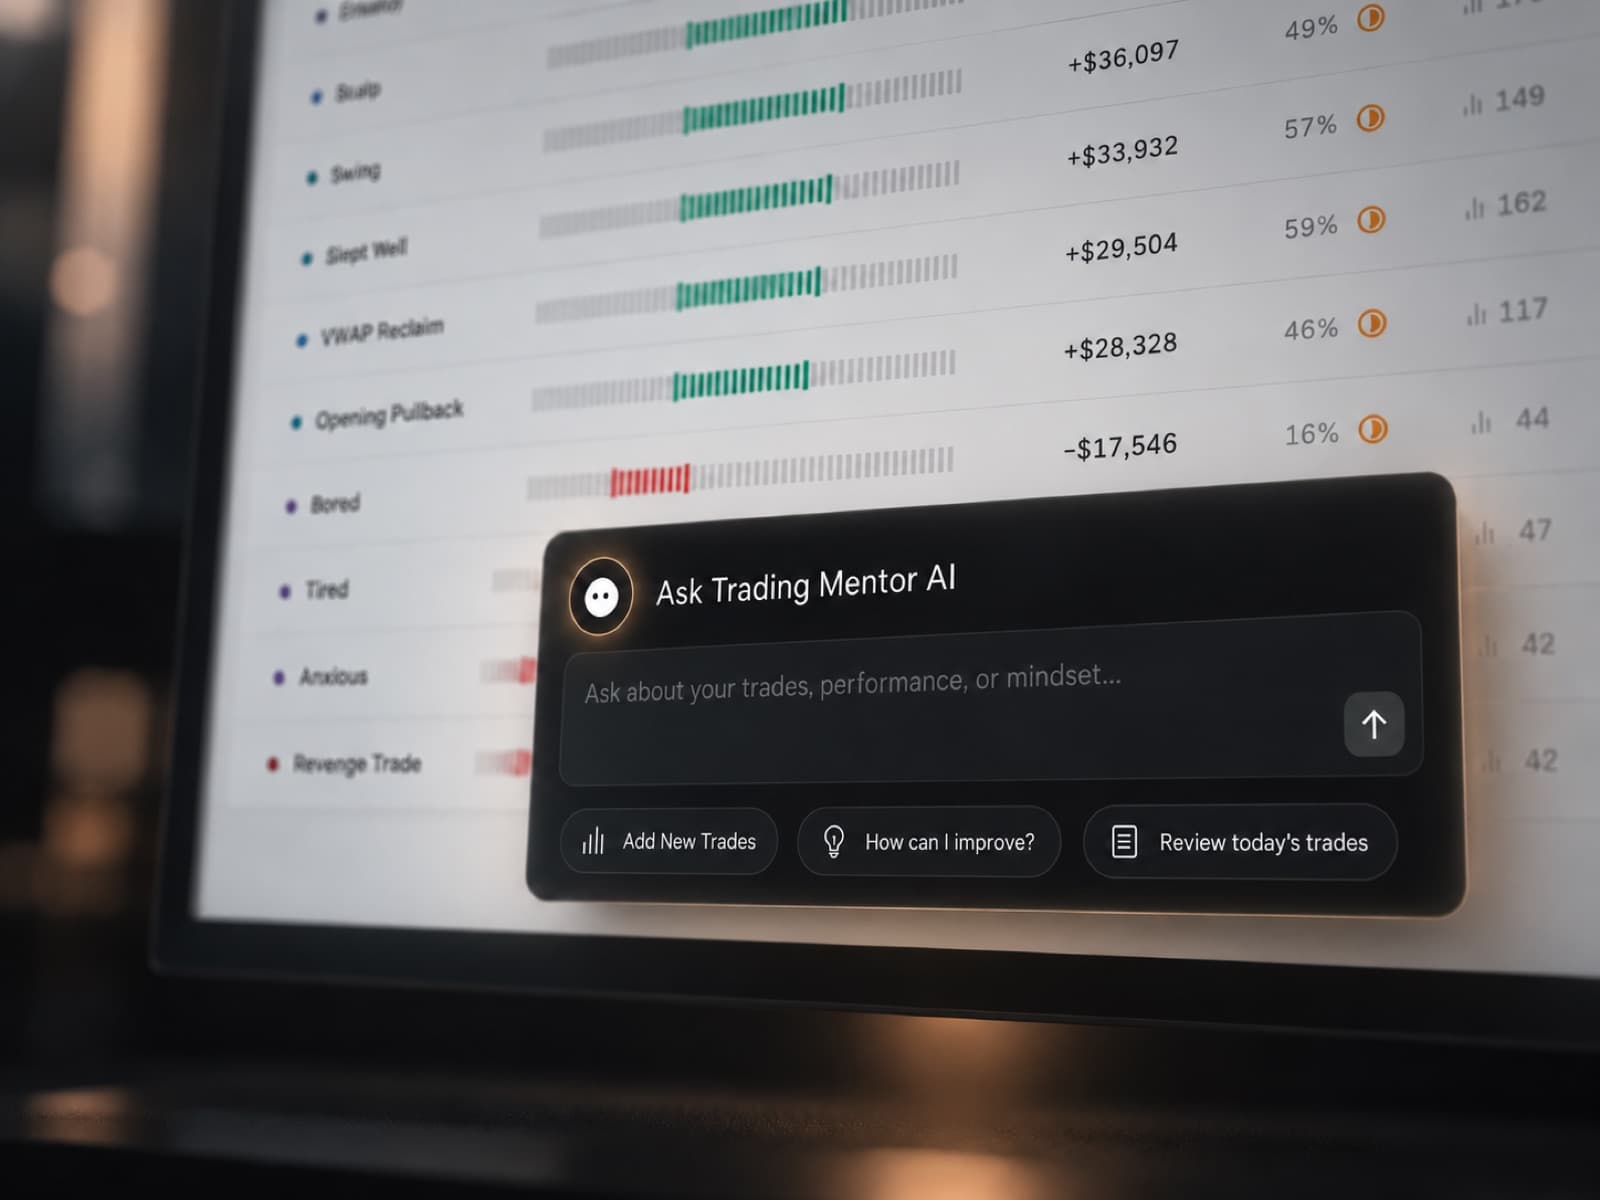
Ask Trading Mentor AI
Start with your question instead of hunting for the right report
Sometimes you know exactly what you want to find out.
You just don't know which report contains the answer.
Ask Trading Mentor AI. For example:
- “Which rule do I break most often?”
- “When do I exit profitable trades too early?”
- “What emotions appear most often on my losing trades?”
- “Which strategy performs best when I follow all of my rules?”
- “What happens to my performance after two consecutive losses?”
Instead of clicking through dashboards looking for a pattern, start with the question.
Your Daily Review Should Be Simple
Import your trades and start reviewing
Connect a supported broker or trading platform and RizeTrade imports your trading history.
You can also:
- Upload CSV files
- Enter trades manually
- Import previous trading history
- Track multiple accounts
- Track fees and commissions
- Use multiple currencies
After import, your trades are automatically available across your charts, calendar, journal, statistics, reports and discipline tools.
No dashboard-building required.
Where TradesViz Is Better
TradesViz is an extremely feature-rich platform.
If you actively want a large analytics toolkit, that's a genuine advantage.
TradesViz currently offers features including:
- 600+ trading statistics
- Hundreds of visualisations
- Highly customisable dashboards
- Hundreds of dashboard widgets
- Grid and pivot analytics
- Trading simulators
- Backtesting
- Options-flow analysis
- Screeners
- Extensive options analytics
- Multiple AI tools
- Broad asset support
- A free stock-journaling tier
If you enjoy digging deeply into data and building a highly customised analytics environment, TradesViz may be the better choice.
Where RizeTrade Is Better
Choose RizeTrade if you want clarity
RizeTrade is designed for traders who don't want another complicated piece of trading software.
Choose RizeTrade if you're asking:
- Can I understand today's trading quickly?
- Did I follow my rules?
- Which mistakes keep repeating?
- Which strategy am I actually good at trading?
- Are emotions affecting my results?
- Am I managing my trades efficiently?
- What should I work on tomorrow?
Those questions don't require 600 statistics.
They require the right information to be obvious.
That's what RizeTrade is built around.
TradesViz Has More Features. RizeTrade Has Less Clutter.
That distinction matters.
RizeTrade isn't trying to beat TradesViz by adding another 500 widgets.
It is trying to make the trading-journal workflow easier.
TradesViz gives you an enormous analytical toolbox.
RizeTrade gives you a clearer path through your trading data:
- Import
- Review
- Find the problem
- Track the improvement
If you've tried TradesViz and found yourself overwhelmed by dashboards, configuration or the amount of information available, RizeTrade may be a better fit.
TradesViz Alternative FAQs
- Is RizeTrade a TradesViz alternative?
Yes.
Both platforms let traders import trades, journal their activity, review charts and analyse performance.
TradesViz has a significantly broader analytics and simulation feature set.
RizeTrade focuses on a simpler journal experience built around trading discipline, strategy compliance, emotions and execution.
- Is RizeTrade easier to use than TradesViz?
RizeTrade is designed around a more focused workflow with fewer competing analytics surfaces.
TradesViz is intentionally highly configurable and gives traders access to hundreds of statistics, widgets and analysis tools.
If you prefer maximum customisation, TradesViz may suit you better.
If you prefer a clearer, more opinionated journal interface, RizeTrade is likely to be the better fit.
- Does RizeTrade have fewer reports than TradesViz?
Yes.
TradesViz offers significantly more statistics and analytics views.
RizeTrade includes 50+ automatically generated reports and focuses on making the most relevant trading information easier to access.
- Does RizeTrade track trading discipline?
Yes.
RizeTrade includes dedicated discipline tracking, strategy playbooks, rule-follow scoring and progress tracking.
- Does RizeTrade track emotions?
Yes.
Add emotions to individual trades and analyse how different emotional states correlate with your trading performance.
- Does RizeTrade have AI?
Yes.
Trading Mentor AI lets you ask questions about your trading history and investigate patterns in your own trading data.
- Does RizeTrade have backtesting?
RizeTrade is primarily designed for reviewing actual trading performance.
TradesViz has the stronger dedicated backtesting and simulation toolset.
If backtesting and replay-style practice are central to your workflow, TradesViz may be the better choice.
- Does TradesViz have a free plan?
Yes.
TradesViz currently offers a free Basic stock-journaling plan.
Try a Cleaner TradesViz Alternative
You don't need every possible statistic to become a better trader.
You need to know what worked, what went wrong and whether you followed your process.
RizeTrade keeps those answers front and centre.
Import your trades. Review your decisions. Track your discipline. Improve what actually matters.