
Prop Firm Trading Journal
100% FreeNo CC Required
4.8/5 1,794 Reviews
Track multiple prop firm accounts
Track trades across multiple prop firm accounts, challenges and funded accounts in one RizeTrade journal.
Running more than one challenge or funded account can get messy fast.
RizeTrade lets you bring trades from multiple accounts into one place, while still keeping each account organised.
Track different firms, different challenges and different funded accounts without needing a separate journal for each one.
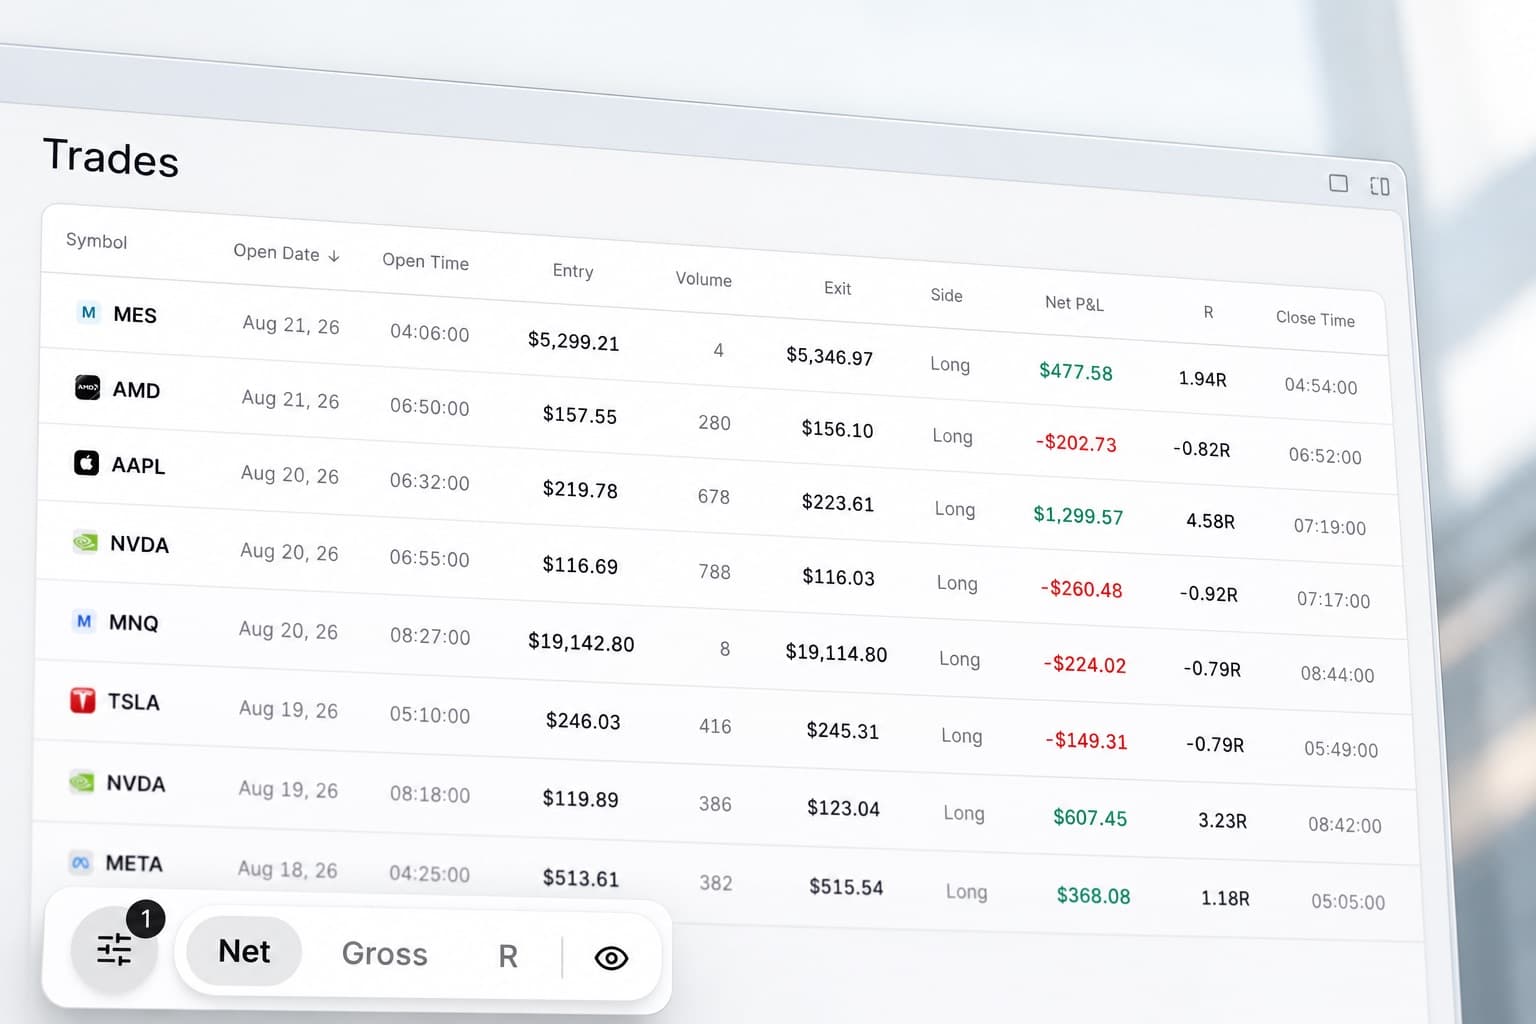
Import trades from different accounts
Bring supported trading data into RizeTrade using broker sync or file import. You can also enter trades manually when needed.
Once your accounts are connected, you can review everything from one journal instead of jumping between separate dashboards and spreadsheets.
Broker sync
Connect supported accounts.
File import
Upload your trading history.
Manual entry
Add trades individually when needed.
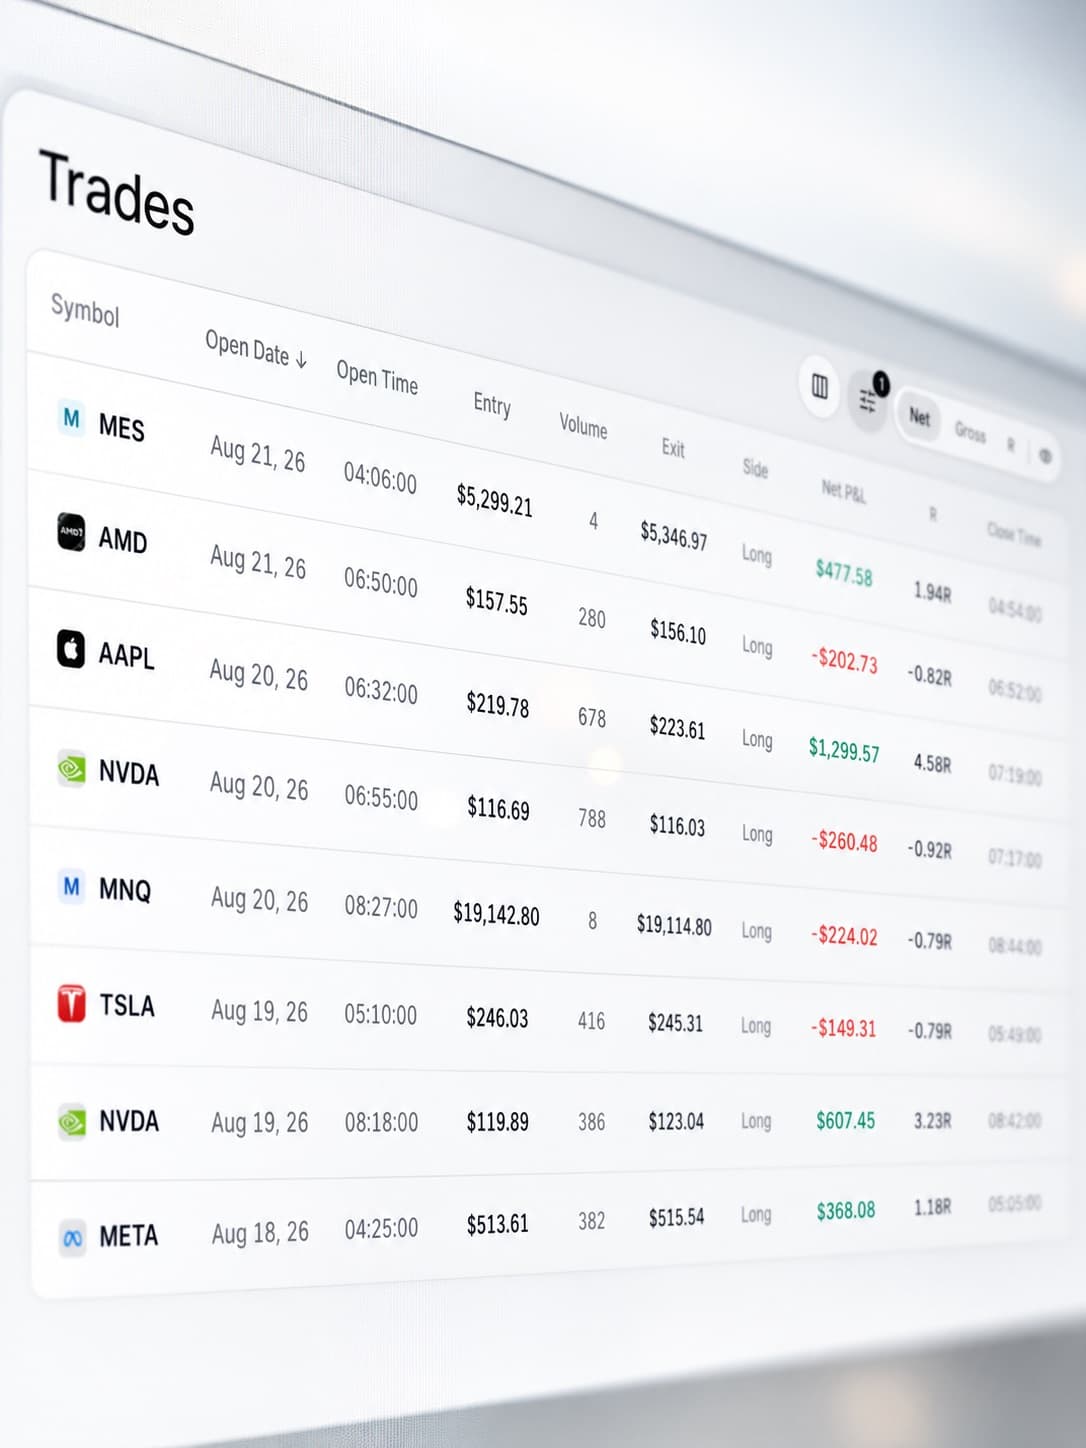
Compare your challenges
Not every account performs the same way.
RizeTrade helps you compare how you trade across different prop firm challenges.
See where your results are strongest, which accounts are struggling and whether your execution changes when the rules or account size change.
This is especially useful when you are running several evaluations at the same time.
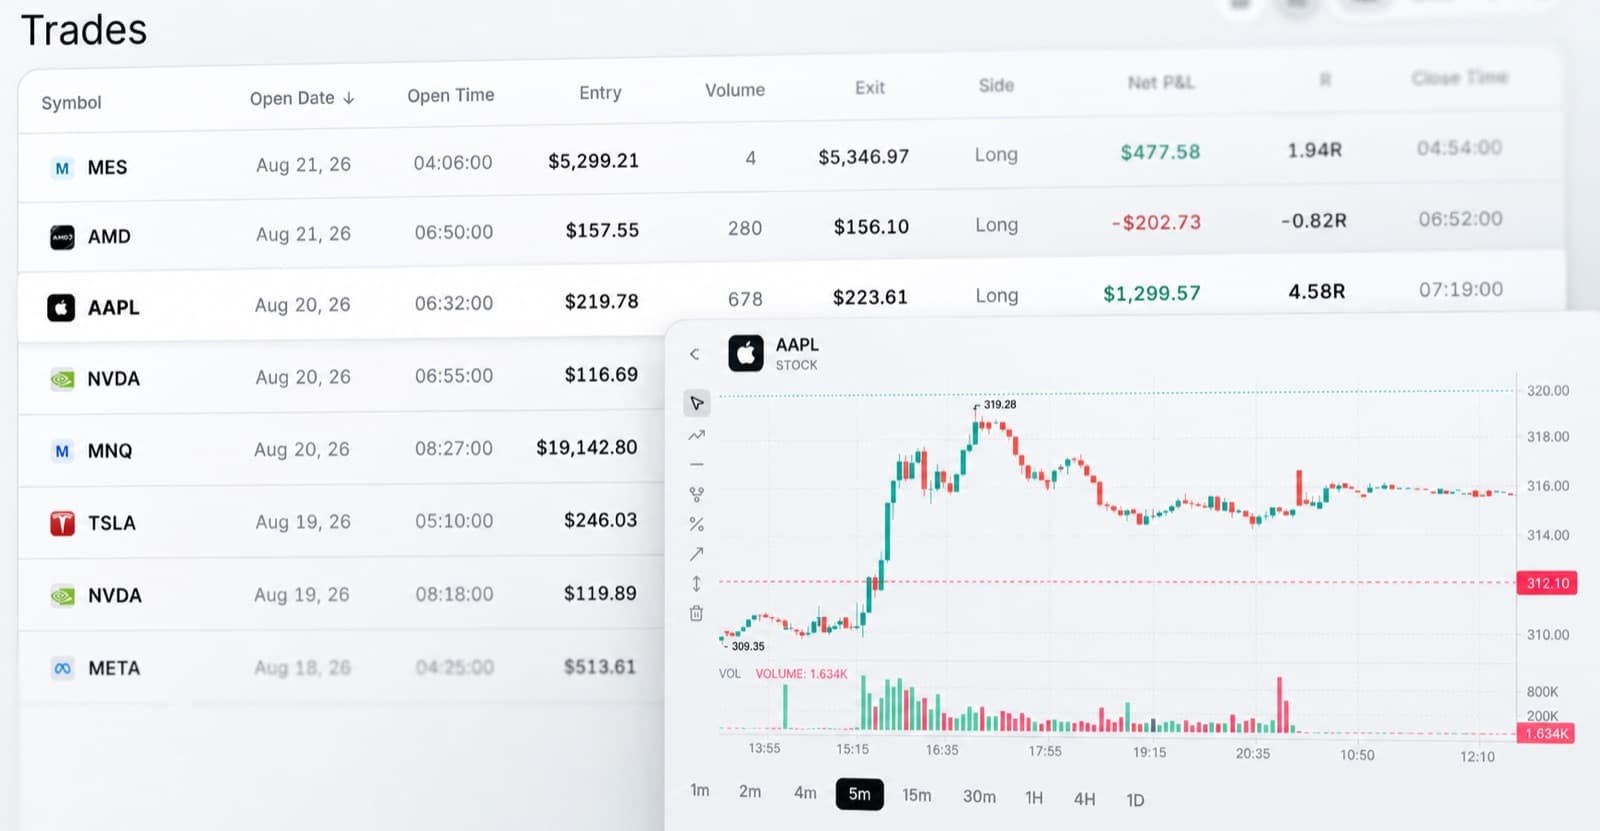
Review funded accounts separately
Keep funded accounts separate from evaluation accounts while still managing them inside the same journal.
Review each account on its own or step back and compare performance across your full prop firm portfolio.
That makes it easier to understand which accounts are progressing well and where your process needs more attention.
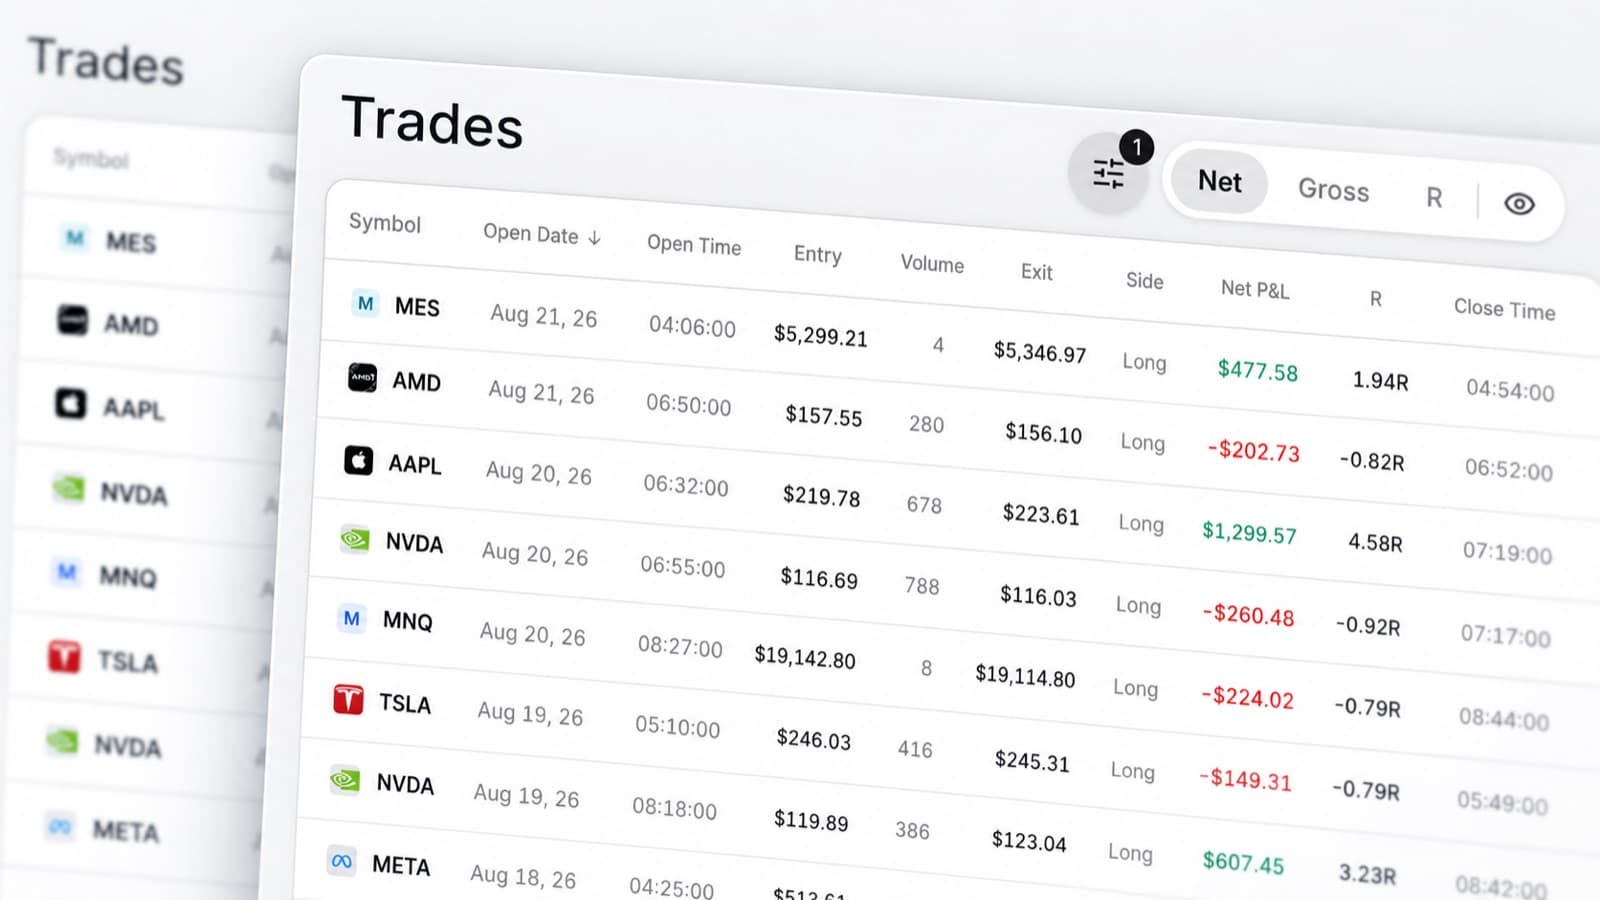
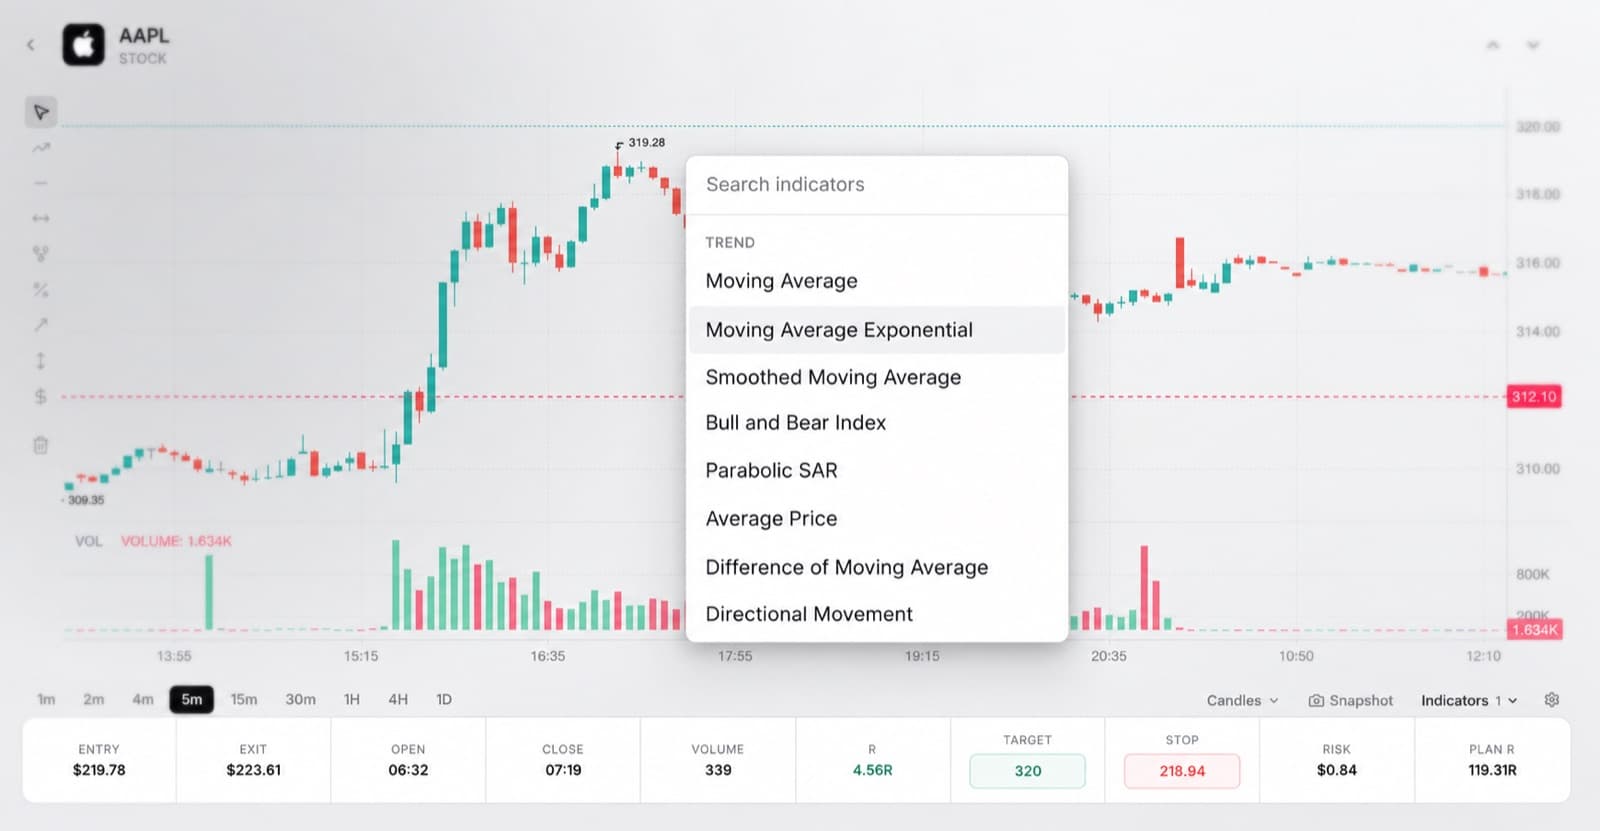
Review past trades on the chart
Open previous trades and see your entries and exits directly on the chart.
Review how the position developed, whether the setup matched your plan and how the trade was managed.
This gives you more context than simply looking at whether the trade passed or failed part of a challenge.
Analyse your trading with AI
Trading Mentor AI helps you analyse the history across your journal.
Ask questions about a single account, a specific challenge or your wider trading behaviour.
- Which challenge am I trading best?
- What mistakes keep appearing across my funded accounts?
- Does my execution change when I am close to a drawdown limit?
- Which accounts have my strongest trade grades?
- What behaviour appears most often before a bad trading day?
Use your own journal data to focus on the patterns that matter.

Track challenge performance
A challenge is more than a running P&L number.
RizeTrade helps you review the decisions behind that progress.
Track your results, trade quality and discipline as you work through each account, then use the journal to see whether you are actually trading the challenge according to plan.
Measure trading efficiency
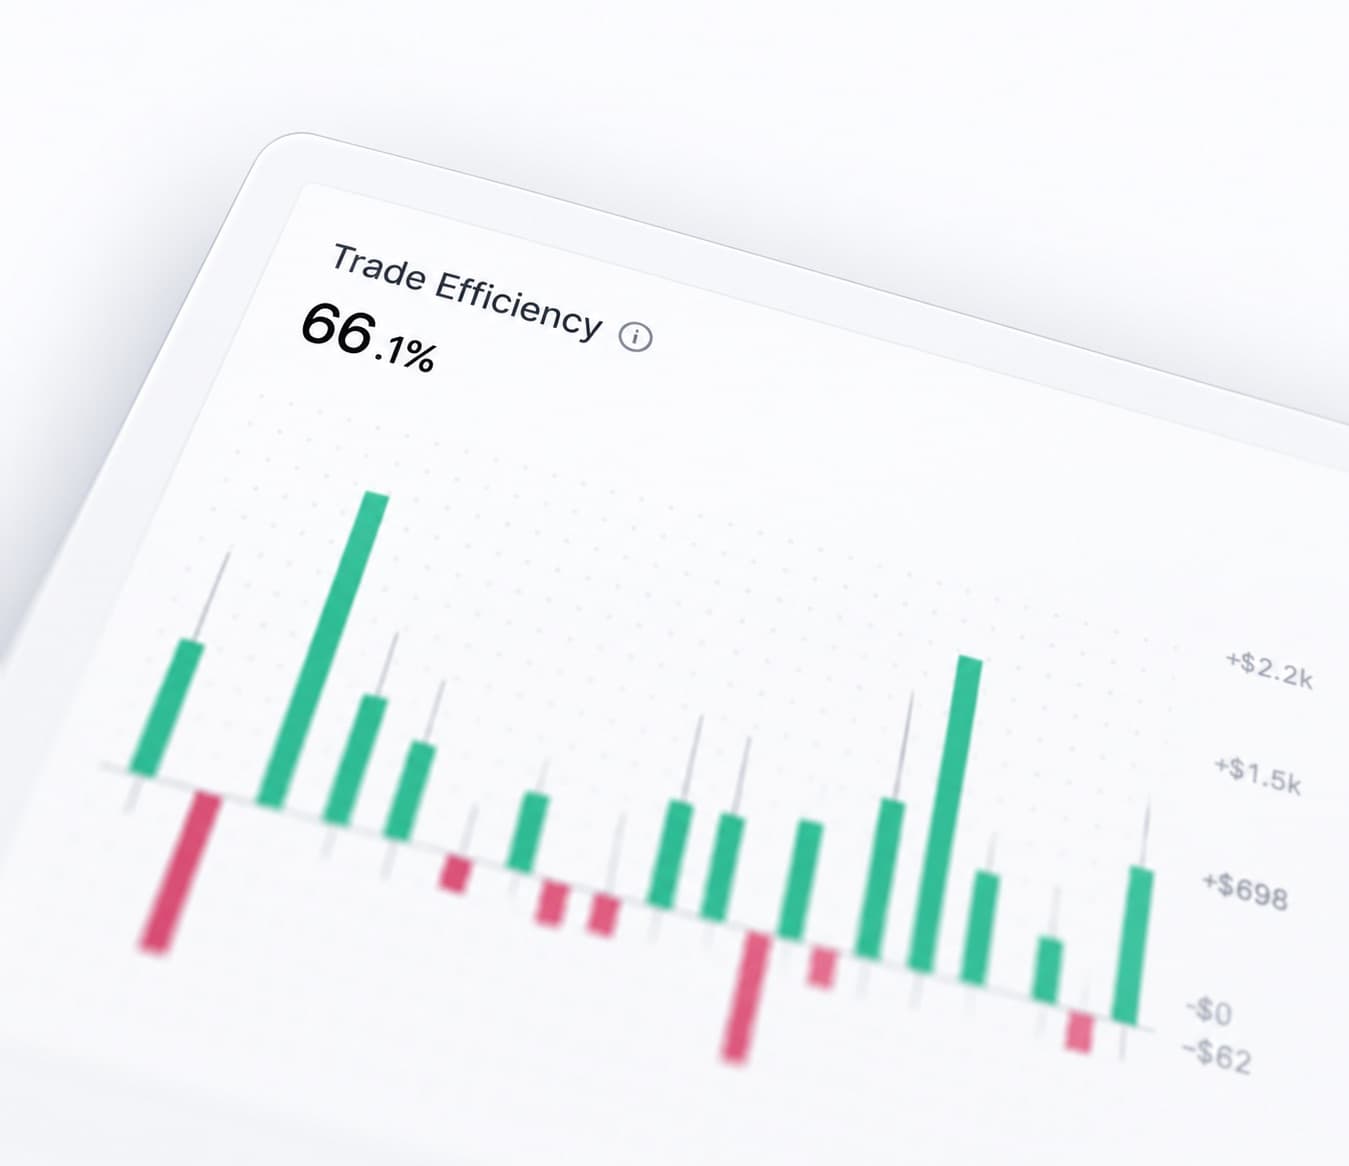
A profitable trade can still be inefficient.
Trading Efficiency helps you review how well each trade was handled, regardless of whether it moved the account closer to a profit target.
Compare execution across different accounts and find where your timing or trade management starts to change.
Grade your trades
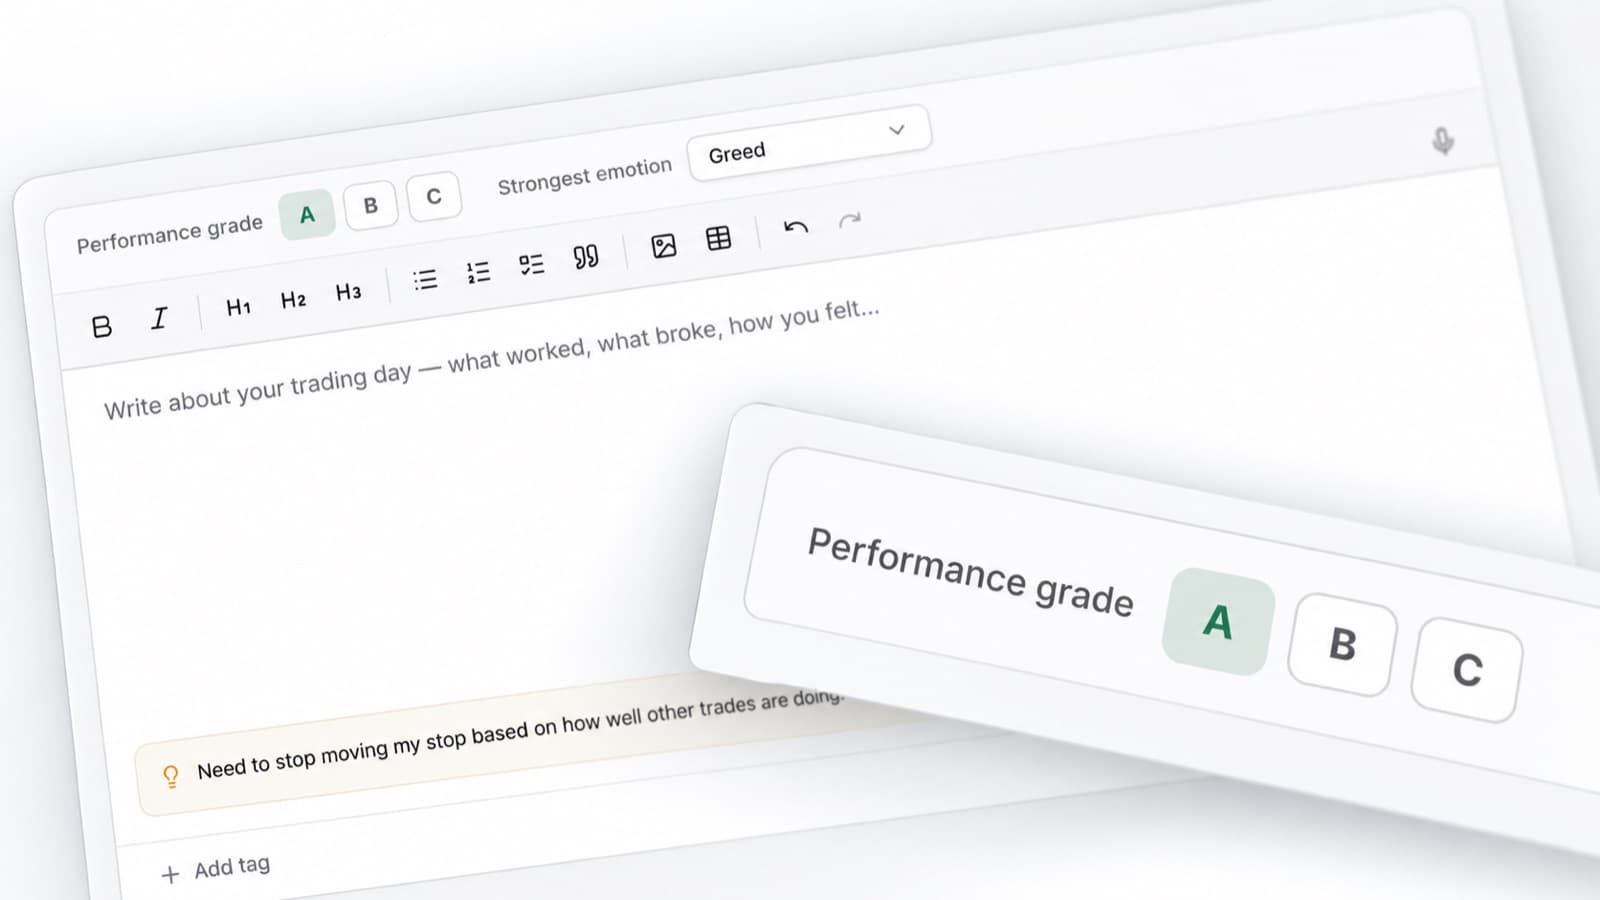
Trade Grade lets you score each trade based on the quality of your decision and execution.
This matters when trading prop accounts because short-term results can distort how you judge a trade.
A loss can still be well executed. A win can still come from poor discipline.
Trade Grades help you keep the focus on repeatable behaviour.
Track your emotions
Prop firm rules can add another layer of pressure to a trade.
You may trade differently when approaching a profit target, after a losing day or when an account is close to a drawdown limit.
RizeTrade lets you record those emotions alongside your trades so you can see whether pressure is changing the way you execute.
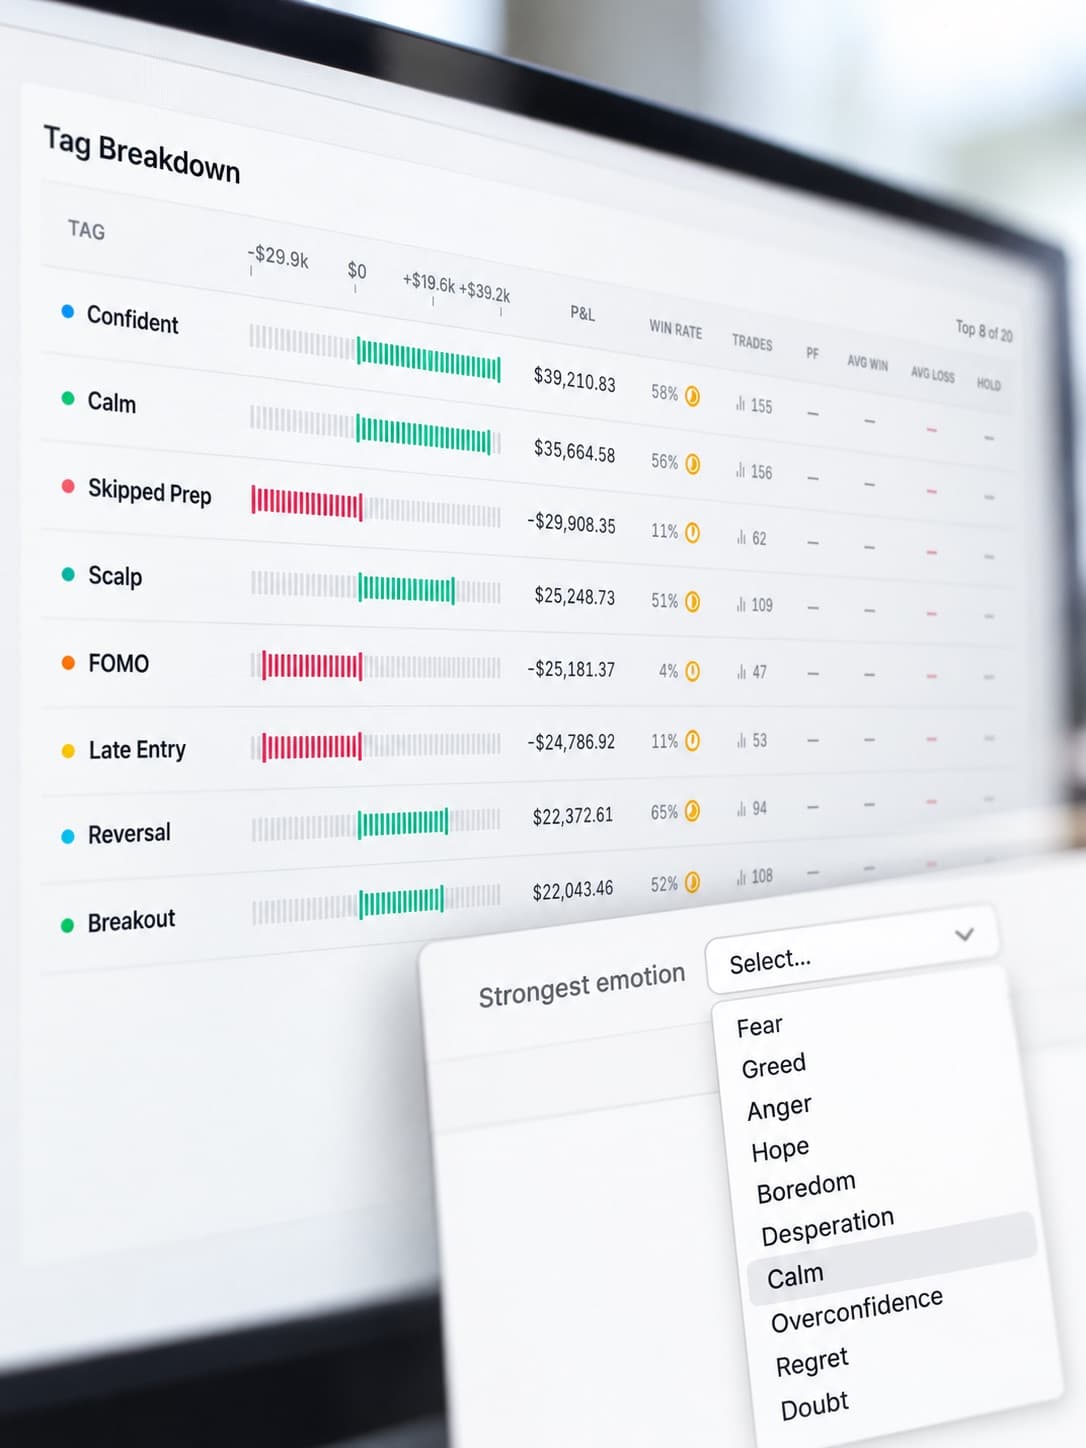
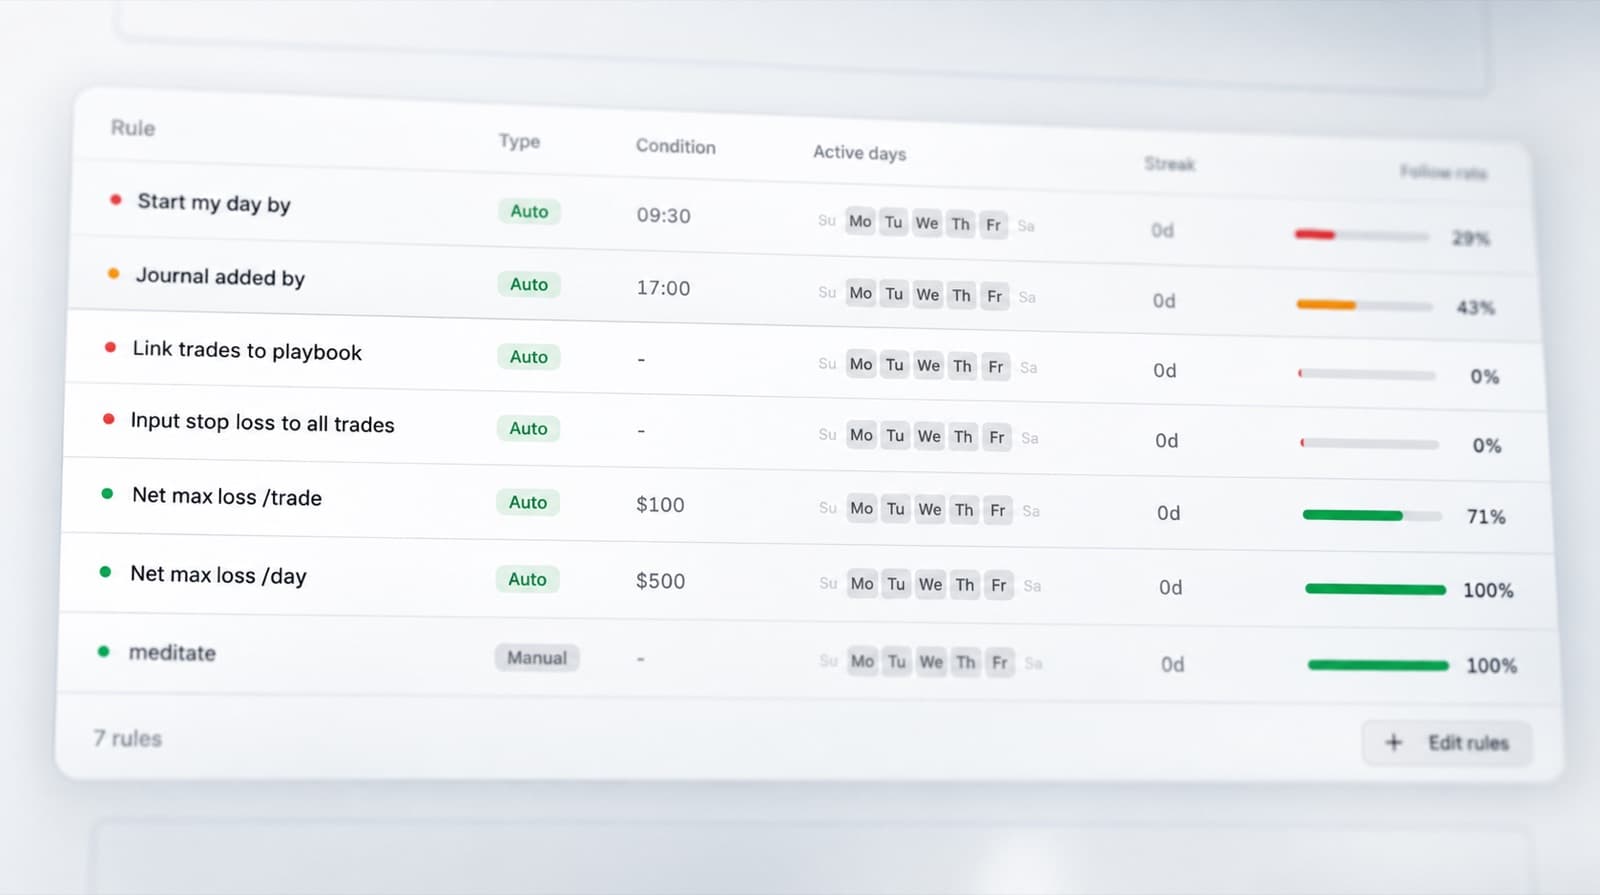
Track your discipline
The Discipline Tracker helps you measure whether you followed your own rules across each account.
Track the behaviours that matter to you and compare discipline between challenges, funded accounts and trading periods.
This makes it easier to see whether poor results came from your strategy or from how you executed it.
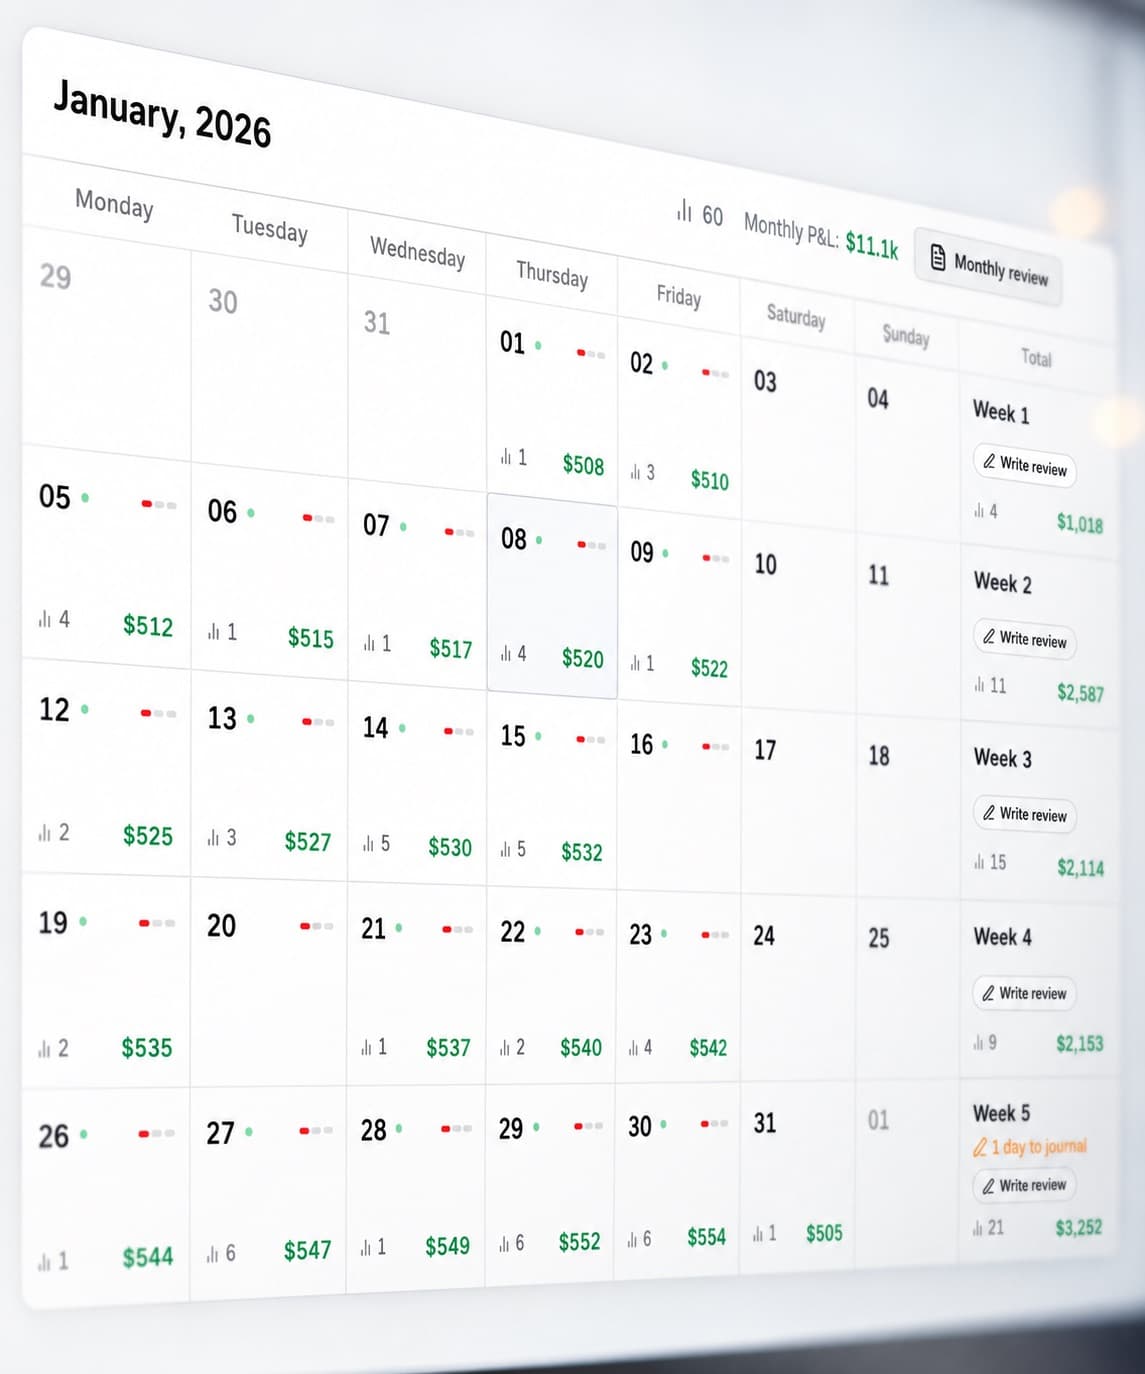
View your P&L calendar
See your trading results across the month in one visual view.
Use the P&L Calendar to spot strong days, difficult periods and changes in trading activity.
You can then drill into the accounts and trades behind each day to understand what happened.
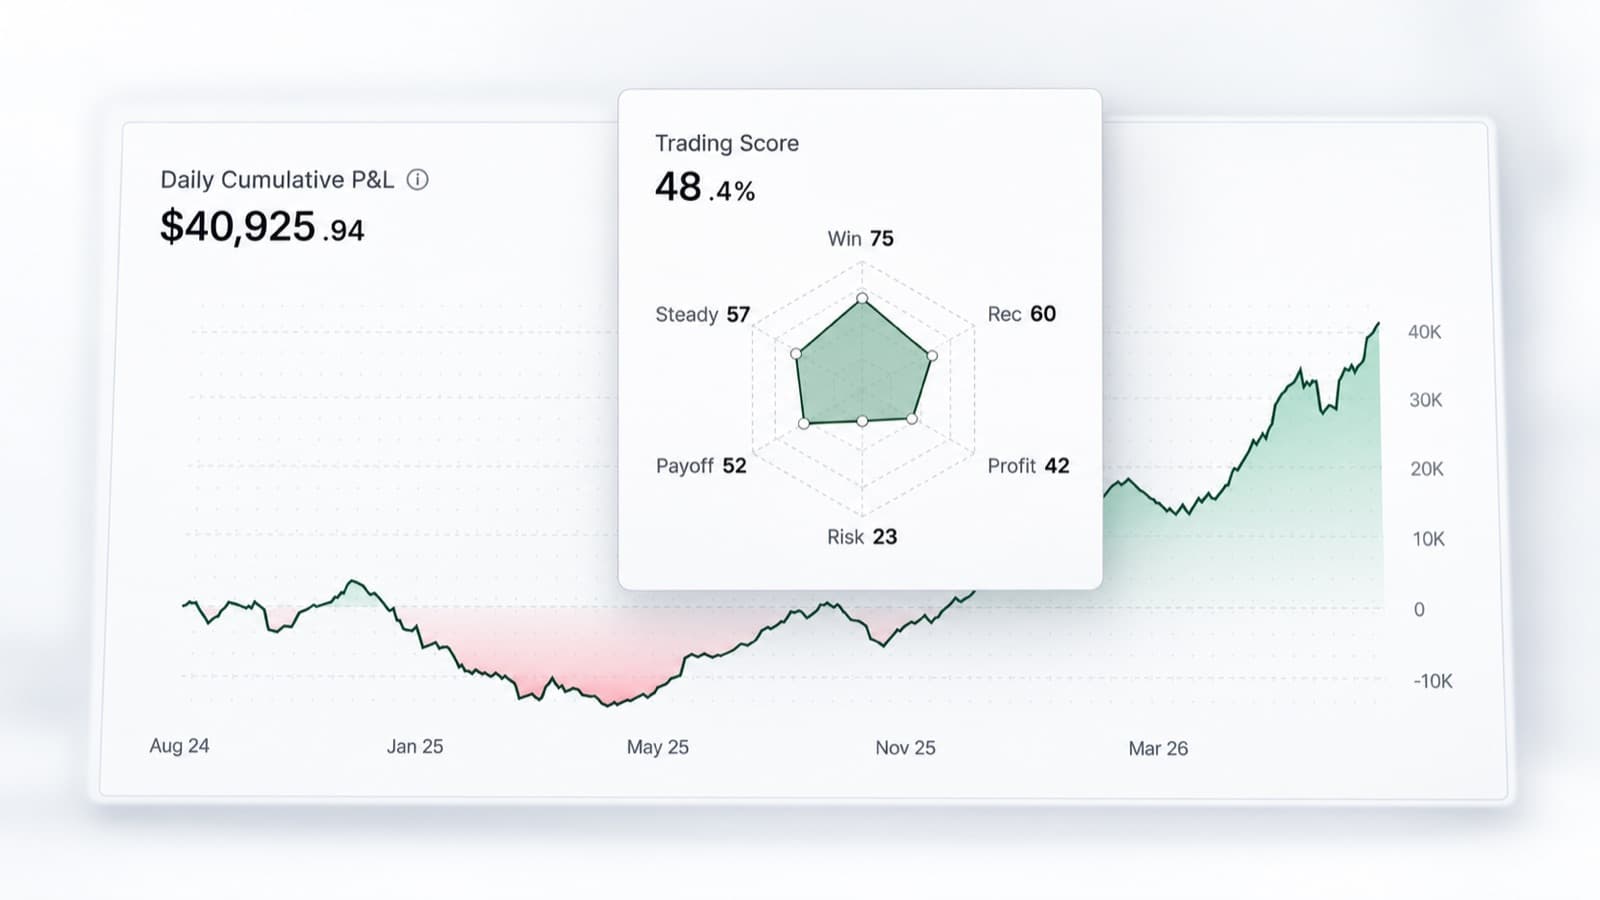
Compare your trading statistics
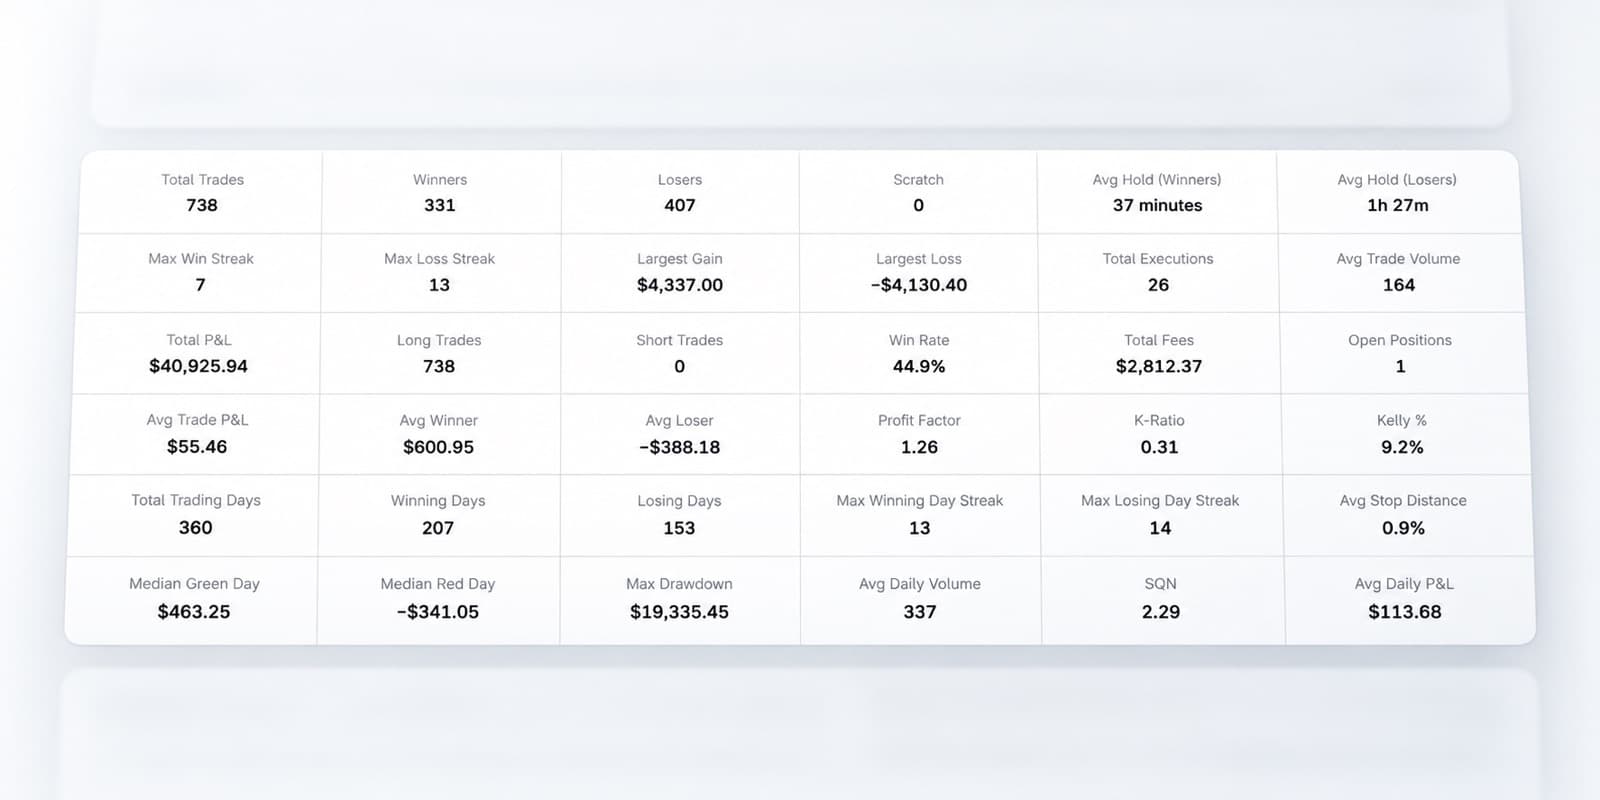
RizeTrade Statistics help you look across more than one trade or account.
Compare performance between challenges. Review funded account results. Look for recurring mistakes across firms. See whether your execution is becoming more consistent over time.
This gives you a clearer view of how you perform across the whole prop firm side of your trading.
Build prop firm journal reports
Journal Reports give you a structured way to review your trading across multiple accounts.
Bring together your performance, discipline, trade grades, emotions and execution.
Use reports to review one account in detail or compare several challenges and funded accounts side by side.
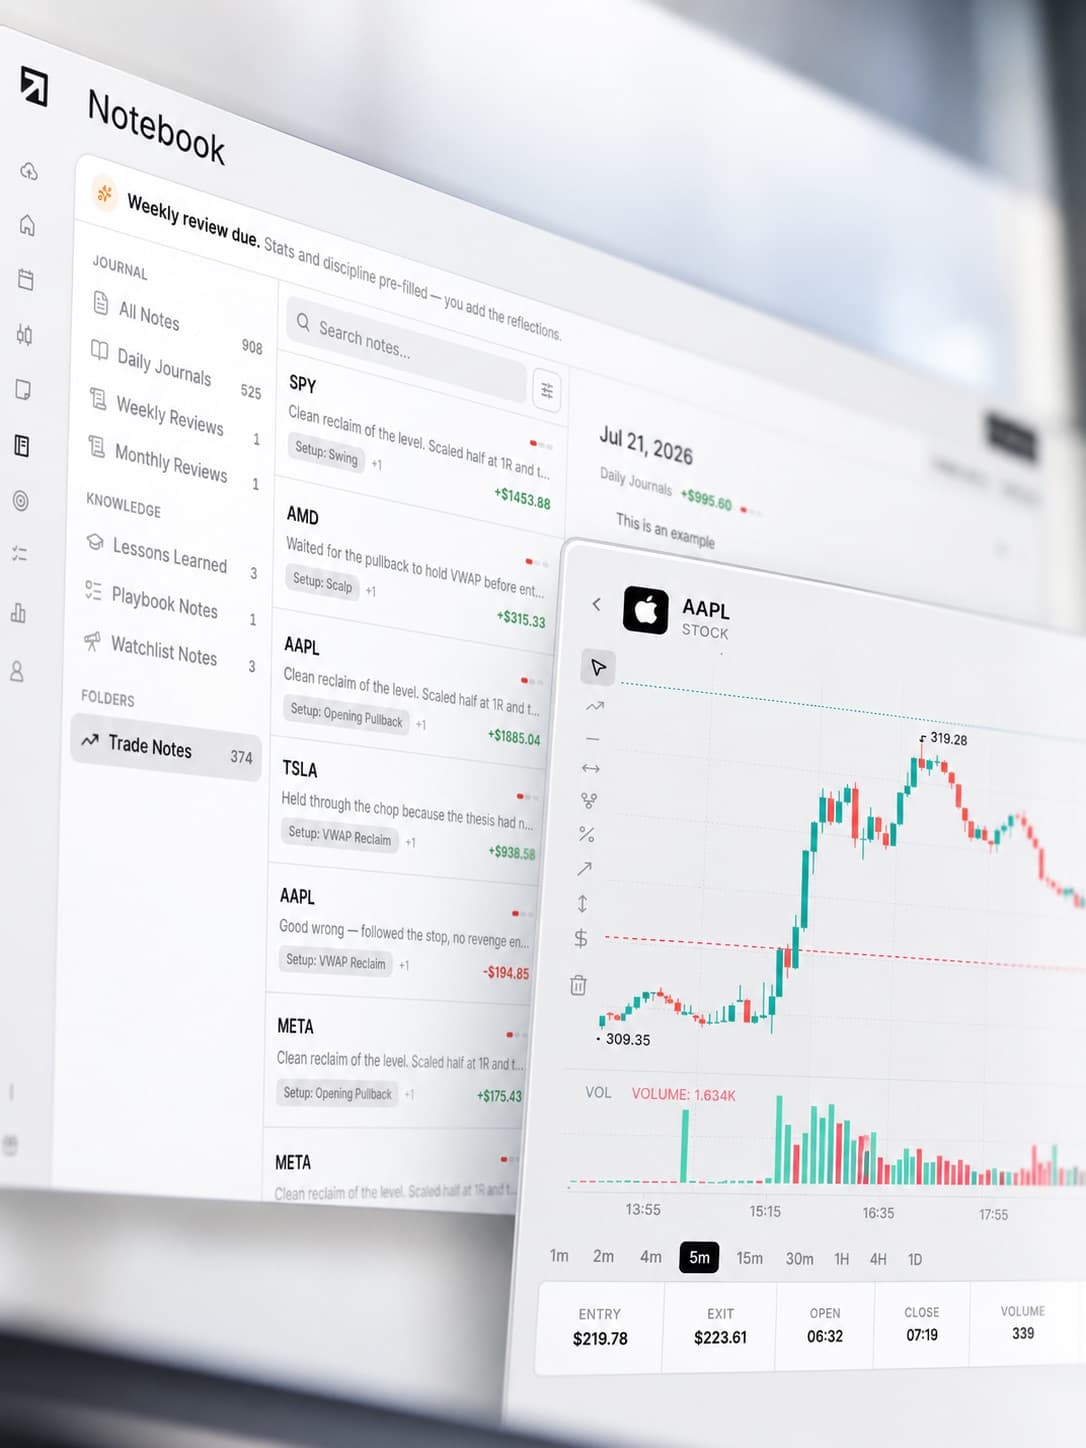
Prop firm journal features
Multiple account tracking
Keep different challenges and funded accounts organised in one journal.
Trading Mentor AI
Analyse patterns across individual accounts or your full trading history.
Past trade charts
Review entries and exits in market context.
Trading efficiency
Measure the quality of your execution.
Trade grade
Score each trade separately from its P&L result.
P&L calendar
Review your trading performance across the month.
Broker sync & file import
Bring supported trading data into RizeTrade.
Manual trade entry
Add individual trades yourself.
Emotion tracking
See how pressure and mindset relate to your results.
Discipline tracker
Measure whether you followed your trading rules.
Statistics
Compare performance across accounts and challenges.
Journal reports
Create structured reviews from your prop firm trading data.
Manage your prop firm trading in one place
Whether you are running one challenge or managing several funded accounts, RizeTrade gives you one place to review how you are trading.
Compare accounts, review execution, track discipline and understand what changes from one challenge to the next.