
Rize Trade does not have separate report tabs named Liquidity, Market Behavior or Advanced. Those ideas show up inside the real Reports tabs, especially Instrument, plus deeper metrics on Statistics, Time and Trade.
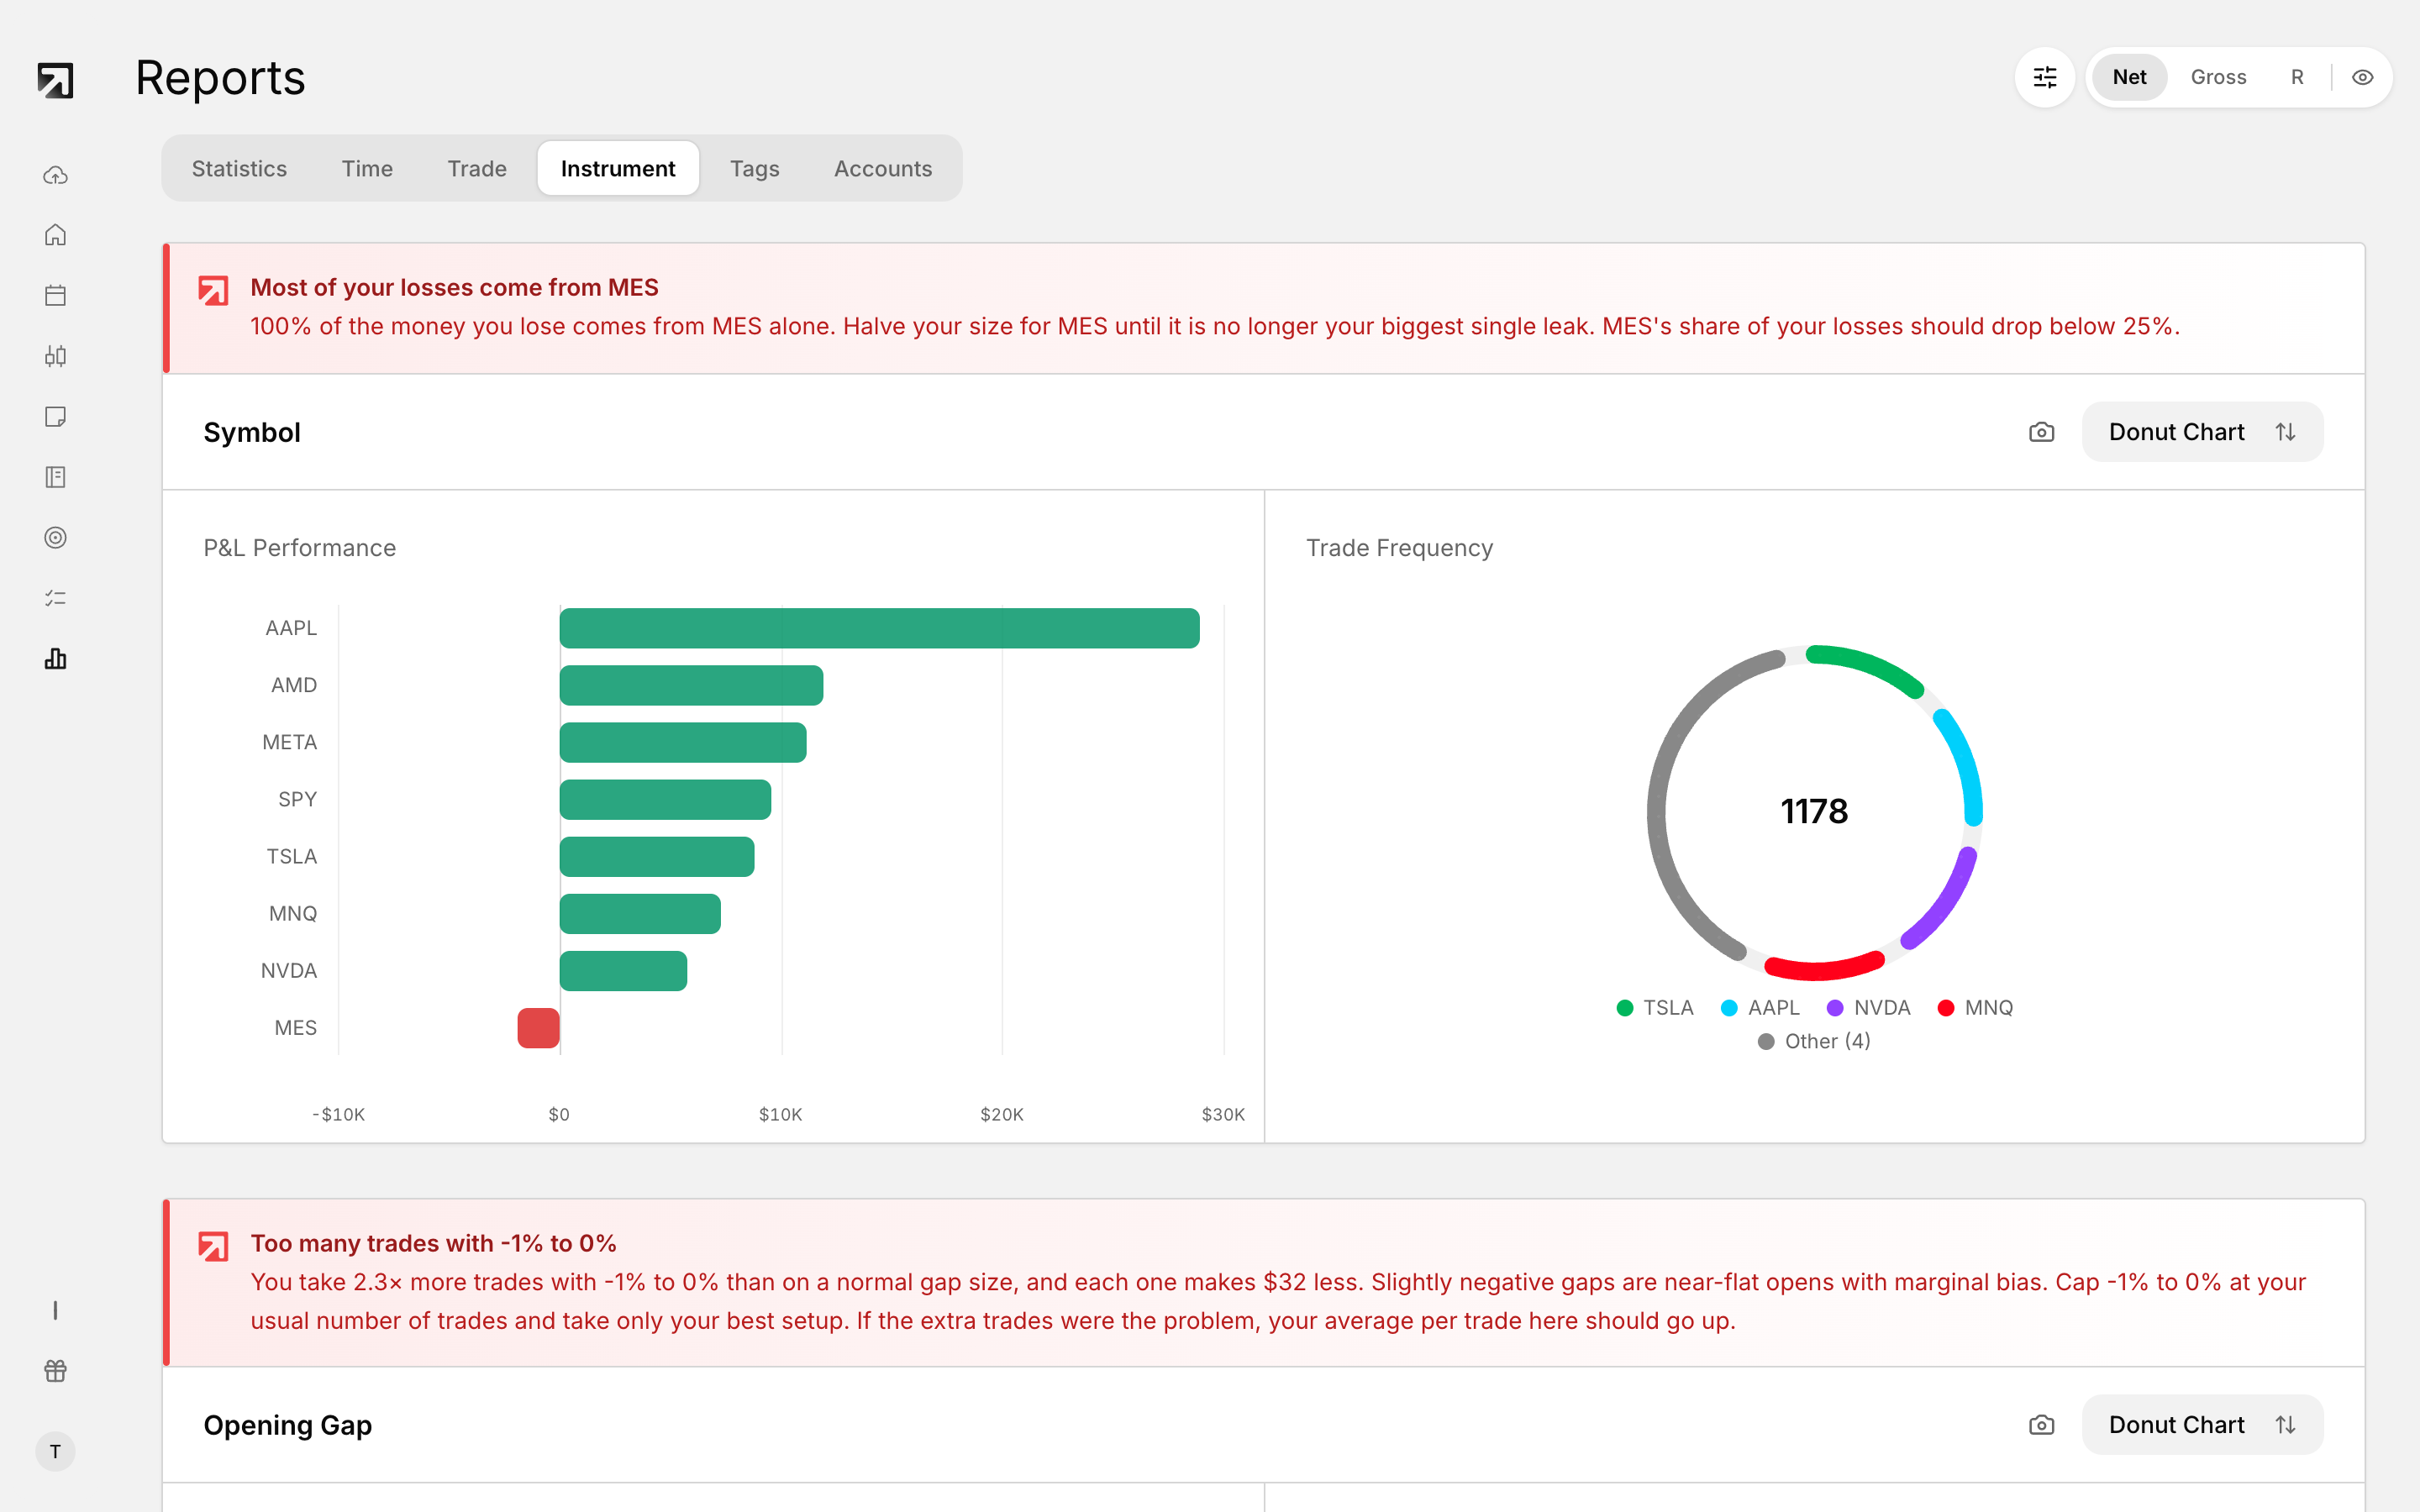 The Instrument tab in Reports.
Where to look instead
- Instrument — symbol performance plus opening gaps, intraday movement, instrument volume and day type
- Statistics — deeper metrics such as SQN, Kelly %, Expectancy Ratio, Max Drawdown and P&L Std Dev
- Time — Day of Week, Hour of Day, Month of Year and Intraday Duration
- Trade — Entry Price, Volume Traded and In-trade Price Range
- Tags — performance broken down by the tags on your trades
Instrument tab, market behavior and volume context
Symbol
Groups your trades by instrument so you can compare performance across tickers.
Opening Gap
Bins trades by the percent gap between that day's open and the prior close. Ranges run from <-3% through >3% in 1% steps. Bins with no trades are hidden.
Intraday Movement
Bins same-day trades by the percent move from open to close. Only trades that open and close on the same date are included.
Instrument Volume
Bins trades by the underlying instrument's daily volume: <100K, 100K-500K, 500K-1M, 1M-5M, 5M-10M, 10M-50M, 50M-100M and 100M+. This is the closest built-in view for liquidity-style context.
Day Type
- Trend Up — close above the prior high, with open near the low and close near the high
- Trend Down — close below the prior low, with open near the high and close near the low
- Inside Range — today's high and low stay inside the prior day's range
- Outside Range — the day breaks the prior high or low without qualifying as a trend day
When Instrument sections need market data
Opening Gap, Intraday Movement, Instrument Volume and Day Type need daily price data, fetched automatically when available.
- While data loads you see Loading instrument data...
- If nothing comes back you see No instrument market data yet
- Symbol still uses your trade history
Statistics, Time and Trade
Statistics metrics
SQN, Kelly %, Expectancy Ratio, Max Drawdown and P&L Std Dev, alongside win rate, profit factor and expectancy.
Time breakdowns
Day of Week, Hour of Day, Month of Year and Intraday Duration.
Trade breakdowns
Entry Price, Volume Traded and In-trade Price Range.
How to use these views together
- Which symbols and market conditions fit you? > Instrument
- Are the overall edge metrics healthy? > Statistics
- When during the week or day do you perform best? > Time
- Do entry price, size or in-trade range matter? > Trade
- Do tagged setups stand out? > Tags