
Open Reports to see performance metrics across six tabs: Statistics, Time, Trade, Instrument, Tags and Accounts. Filters at the top narrow every tab before you read the numbers.
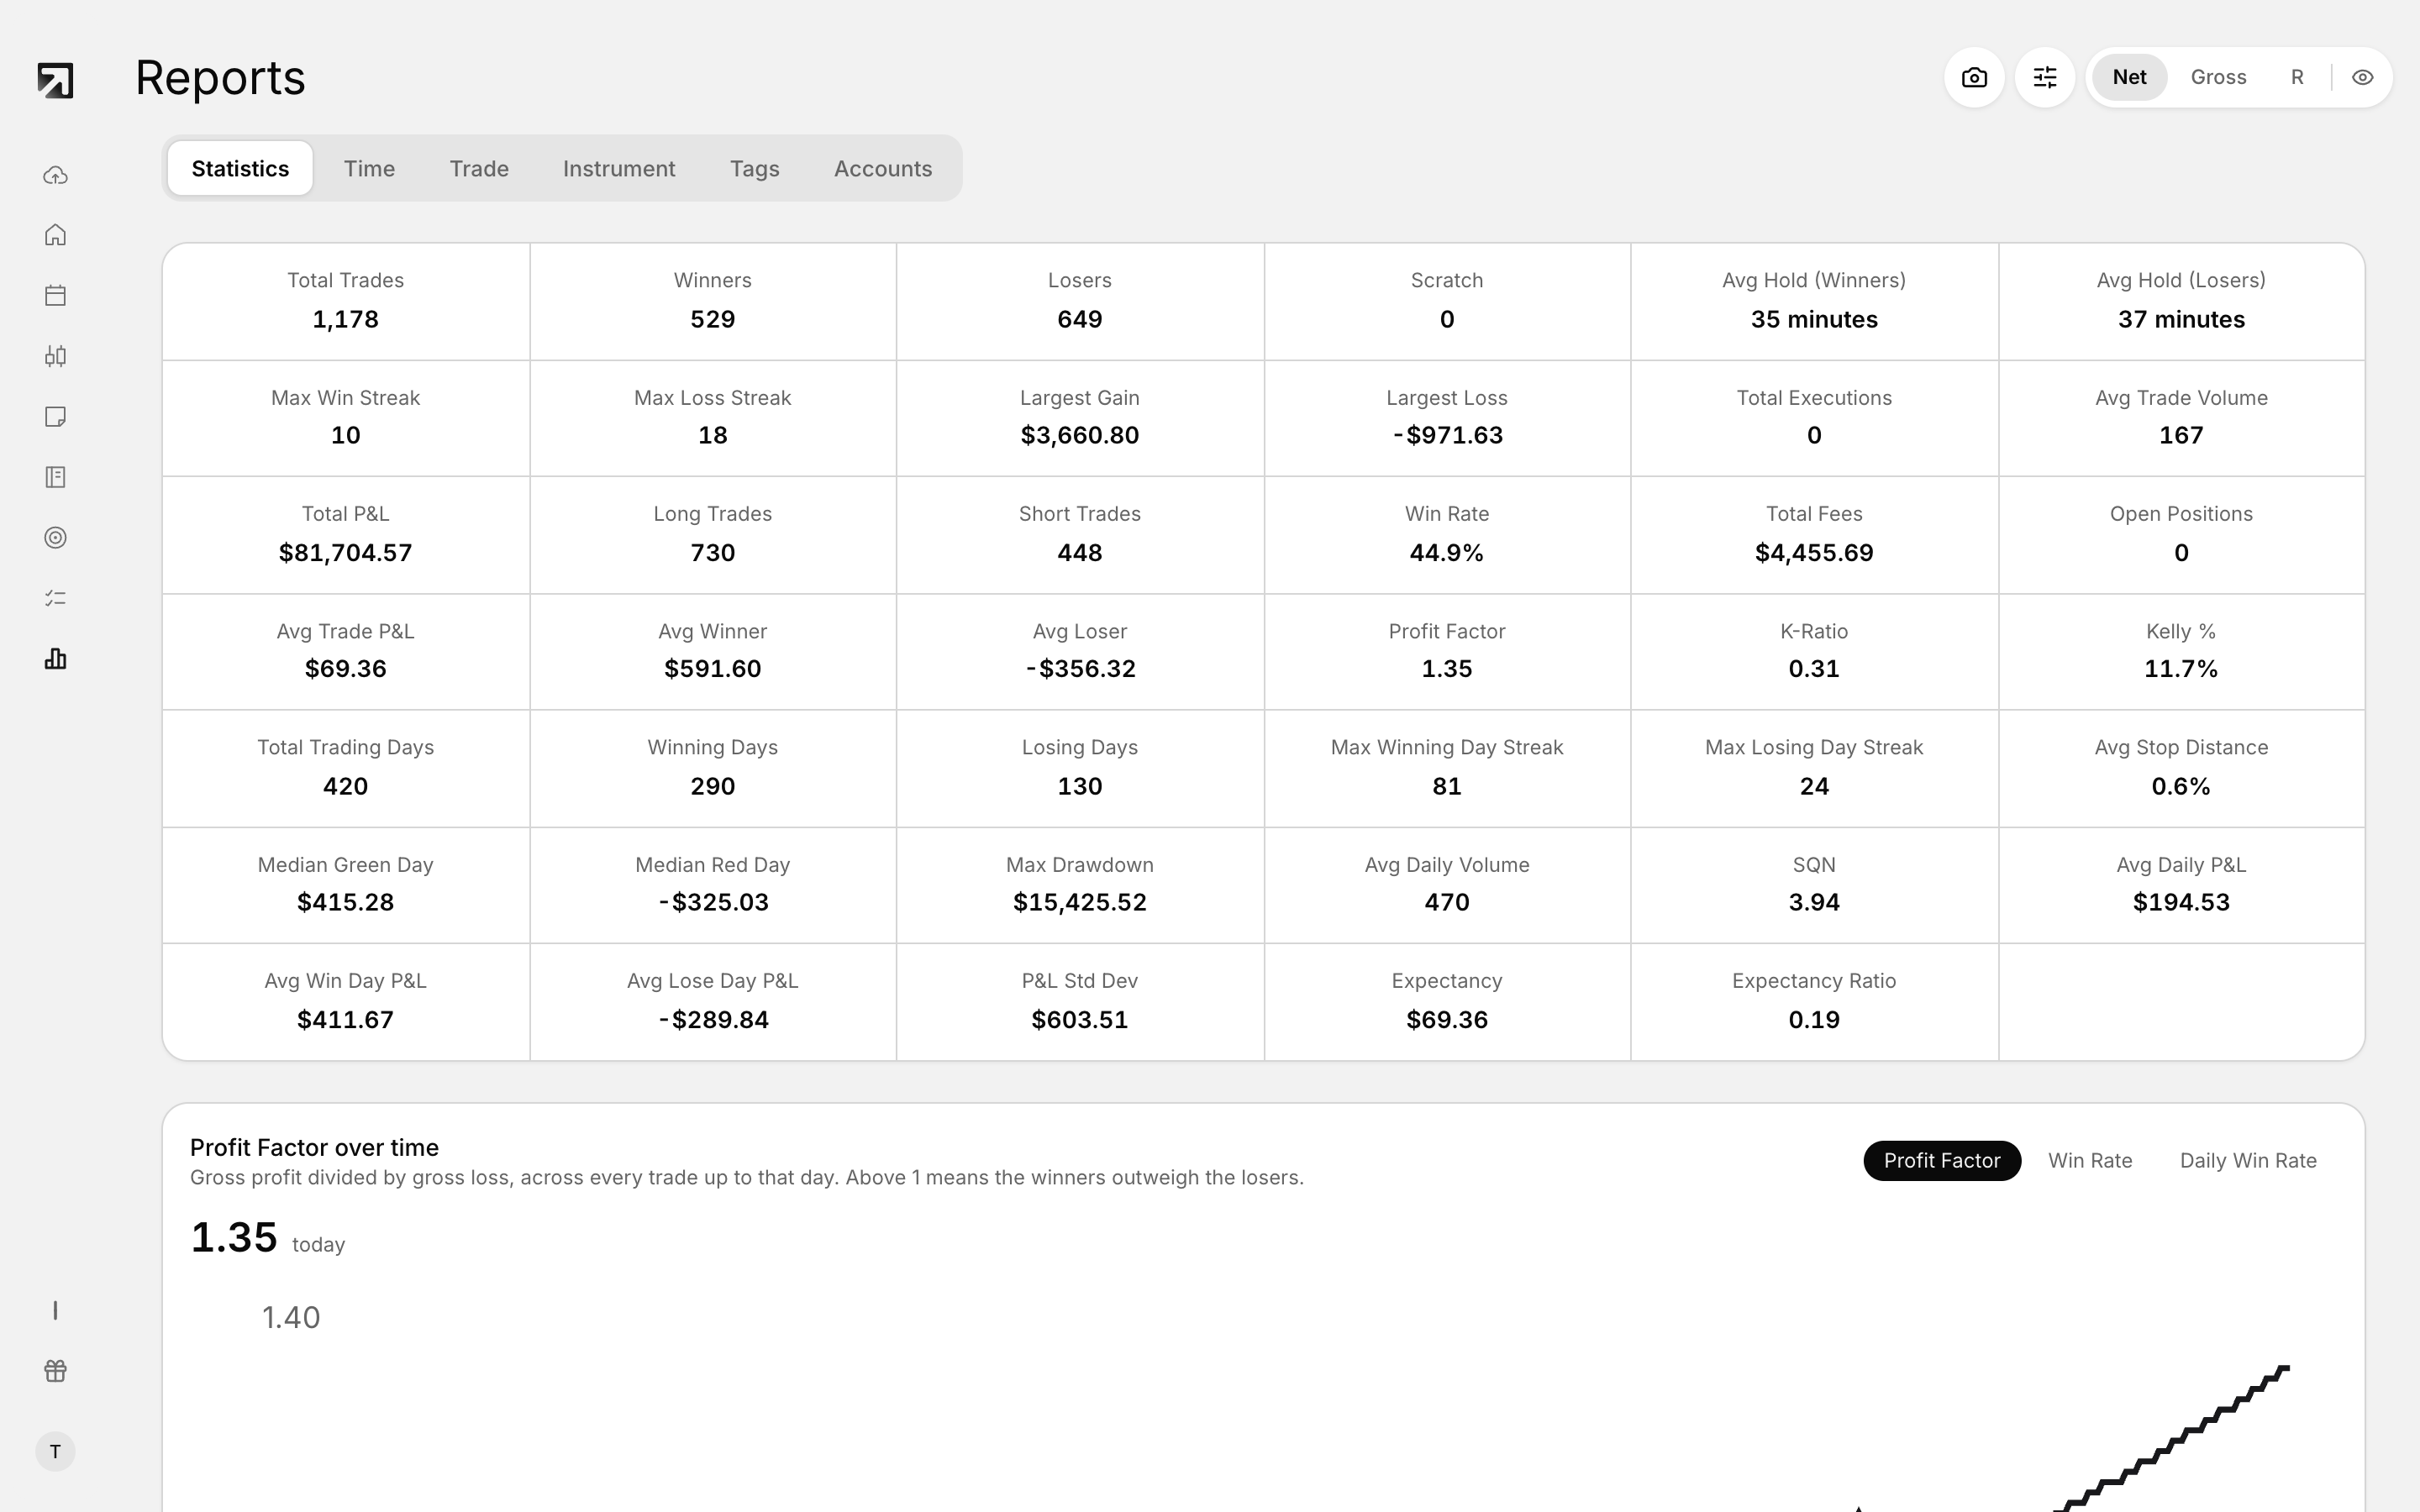 The Statistics tab in Reports, where every metric in this glossary appears.
Statistics
| Metric | What it means | | --- | --- | | Total Trades | Number of trades in the filtered set. | | Winners | Trades with positive P&L. | | Losers | Trades with negative P&L. | | Scratch | Trades that broke even. | | Win Rate | Winning trades divided by total trades, times 100. | | Long Trades / Short Trades | Count of long vs short trades. | | Open Positions | Trades still open in the filtered set. | | Total Executions | Total executions across trades. | | Avg Trade Volume | Average volume per trade. | | Avg Daily Volume | Average volume per trading day. | | Total P&L | Sum of P&L across the filtered trades. | | Total Fees | Sum of fees on those trades. | | Avg Trade P&L | Average P&L per trade. | | Avg Winner | Average P&L of winning trades only. | | Avg Loser | Average P&L of losing trades only. | | Largest Gain | Best single-trade P&L. | | Largest Loss | Worst single-trade P&L. If fills were grouped into one trade, that whole grouped loss counts. See Why does Largest Loss combine multiple trades? | | Profit Factor | Gross profit divided by gross loss. Shows 0 when gross loss is 0. | | Expectancy | Total P&L divided by number of trades. | | Expectancy Ratio | Expectancy divided by average loss when average loss is above 0. | | Kelly % | Win rate minus ((1 minus win rate) divided by (avg win over avg loss)), times 100, floored at 0. | | SQN | Average trade P&L divided by P&L standard deviation, times the square root of trade count. | | P&L Std Dev | Population standard deviation of trade P&L values. | | Avg Hold (Winners) / Avg Hold (Losers) | Average hold time for winners and losers. | | Max Win Streak / Max Loss Streak | Longest run of consecutive winners or losers. | | Total Trading Days | Days with trades in the filtered set. | | Winning Days / Losing Days | Days with net positive or net negative P&L. | | Avg Daily P&L | Average net P&L per trading day. | | Avg Win Day P&L / Avg Lose Day P&L | Average net P&L on winning and losing days. | | Max Drawdown | Largest peak-to-trough drop in cumulative P&L, walked in time order. |
Time
- Day of Week — performance by weekday.
- Hour of Day — performance by hour.
- Month of Year — performance by month.
- Intraday Duration — performance by how long trades were held within the day.
Each section surfaces your strongest bucket.
Trade
- Entry Price — entry pricing across trades.
- Volume Traded — size traded.
- In-trade Price Range — range while the trade was open, using MFE and MAE.
Instrument
Needs daily price data. Until it loads you may see Loading instrument data..., and with no data the empty state is No instrument market data yet.
- Symbol — the instrument being reviewed.
- Opening Gap — gap behavior at the open.
- Intraday Movement — how far price moved during the session.
- Instrument Volume — volume for that instrument.
- Day Type — Inside Range, Trend Up, Trend Down or Outside Range.
Tags
Sections: Tag Performance, Performance Overview and Detailed Breakdown. Highlights call out Most Profitable Tag, Worst Performing Tag, Most Active Tag and Highest Win Rate.
| Metric | What it means | | --- | --- | | Trade count | Number of trades with that tag. | | Winning / losing / breakeven / open | Counts by outcome and open status. | | Long / short | Long vs short counts for the tag. | | Net P&L / Gross P&L | Net and gross P&L for tagged trades. | | Avg net trade P&L | Average net P&L per tagged trade. | | Avg win / Avg loss | Average win and average loss. | | Largest win / Largest loss | Best and worst single tagged trades. | | Profit factor | Gross profit relative to gross loss. | | Trade expectancy | Net P&L divided by number of trades. | | Win rate | Win rate for the tag, plus long and short win rates. | | Avg planned R multiple | Average planned R multiple. See Set your default risk amount. | | Avg realized R multiple | Net P&L divided by initial risk. | | Avg hold time | Average time in trade. | | Longest trade duration | Longest single hold for the tag. | | Total volume / Avg volume | Total and average volume. | | Total commissions / Total fees | Commissions and fees on tagged trades. | | Max consecutive wins / losses | Longest win and loss streaks for the tag. | | Avg MAE / Avg MFE | Average maximum adverse and favorable excursion. |
Accounts
- Account Comparison Chart — select accounts to view performance comparison.
- Accounts table — performance, balance, last update and win rate per account.
Before you trust a number
Every metric reflects the current filter set. When a number looks off, the filter is usually the first place to look.