
Compare performance from Reports > Accounts, with report filters and the Tags, Time and Instrument tabs. There is no separate Compare tab.
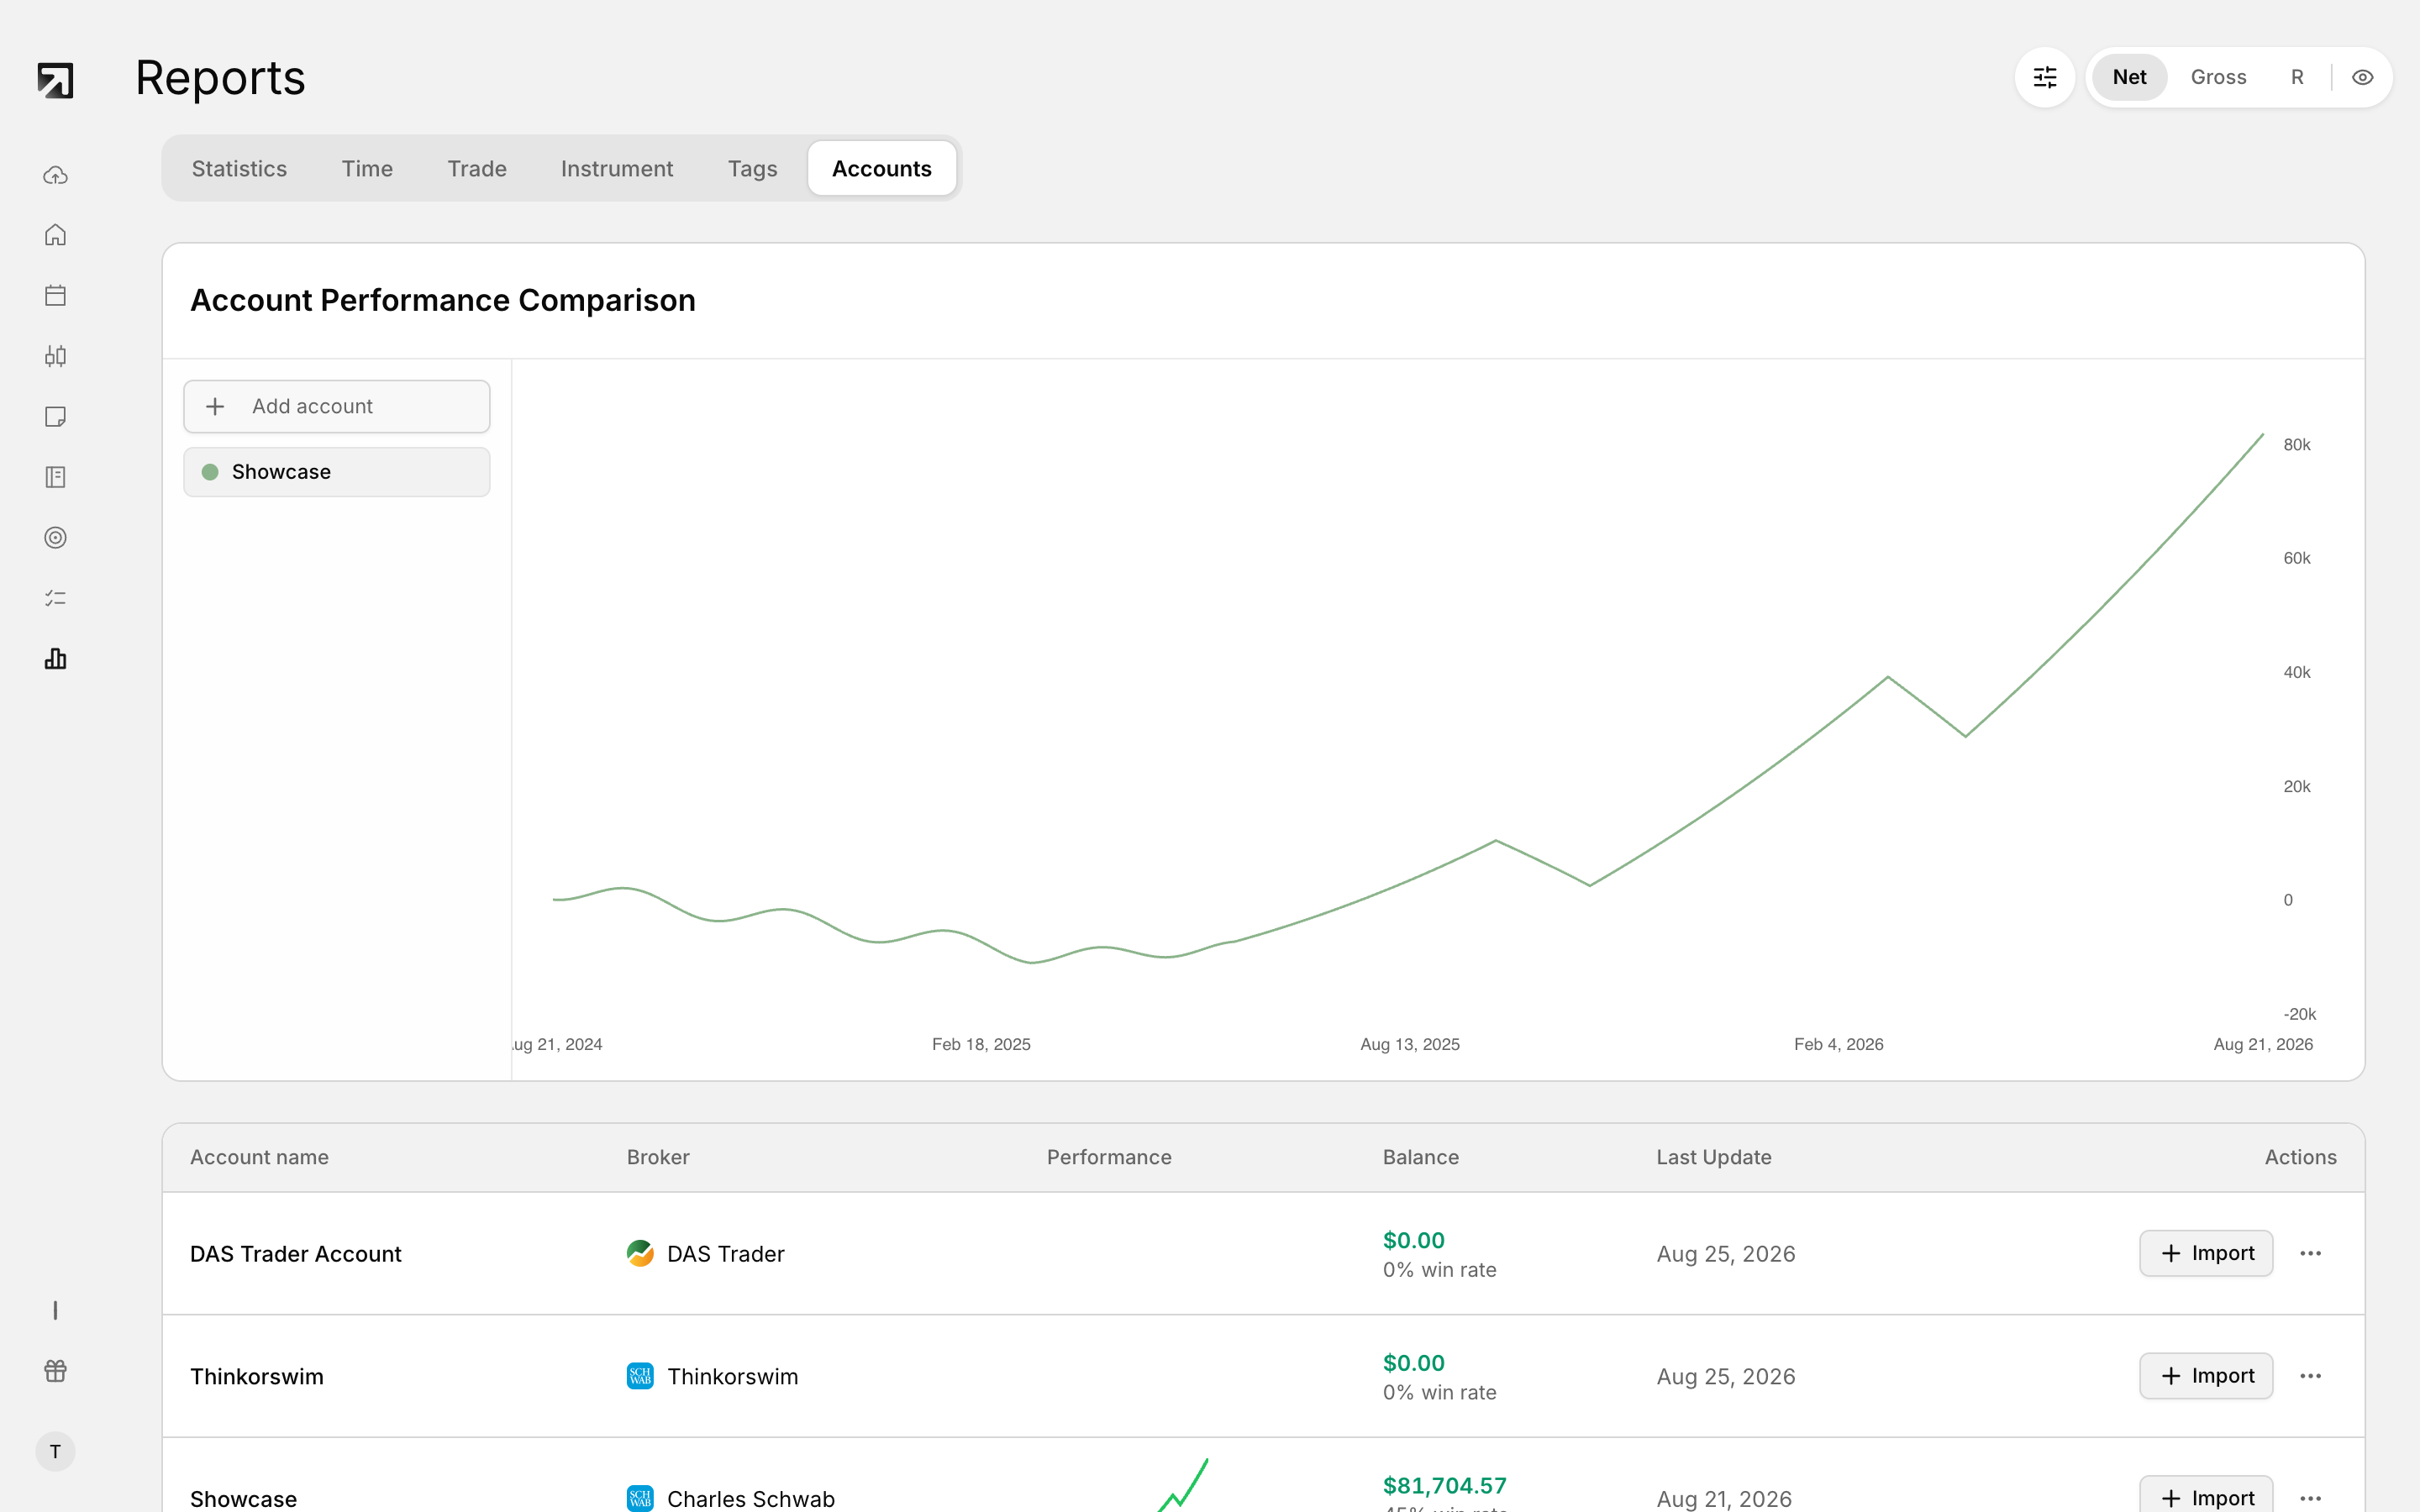 The Accounts tab in Reports compares performance across your trading accounts.
Compare accounts on the Accounts tab
- Open Reports.
- Select the Accounts tab.
- Review Account Performance Comparison, cumulative P&L per account over dates on one chart.
- Add or remove accounts with Add account, or search in Search accounts....
- Narrow the chart timeframe with 1D, 1W, 1M, 3M, YTD, 1Y or All.
All accounts start selected. With no series to plot, the chart shows Select accounts to view performance comparison.
Below the chart, the accounts table lists Account name, Broker, Performance, Balance, Last Update and Actions.
Keep sim and live on separate accounts so the comparison never mixes paper results with real P&L.
Compare with report filters
Apply a filter, read the report tabs, then switch the filter and read again.
- Date range — one period vs another
- Accounts — one account vs another
- Tags — one tag or group vs another
- Symbol — one ticker vs another
- Sides, asset types and statuses — further narrow the set
Compare tags side by side
Open the Tags tab to see tag performance next to each other. Summary cards highlight the most profitable, worst performing, most active and highest win rate tags.
Compare by time or instrument
- Time — day of week, hour of day, month of year and intraday duration.
- Instrument — symbol, opening gap, intraday movement, instrument volume and day type.
What to use when
- Account vs account — Reports > Accounts
- Period, tag or symbol vs another — top filters, then any report tab
- Tag vs tag in one view — Tags tab
- Time of day or duration — Time tab
- Symbol and instrument angles — Instrument tab