
Your Dashboard is the performance home screen. It shows up to four stat cards plus chart widgets you can rearrange.
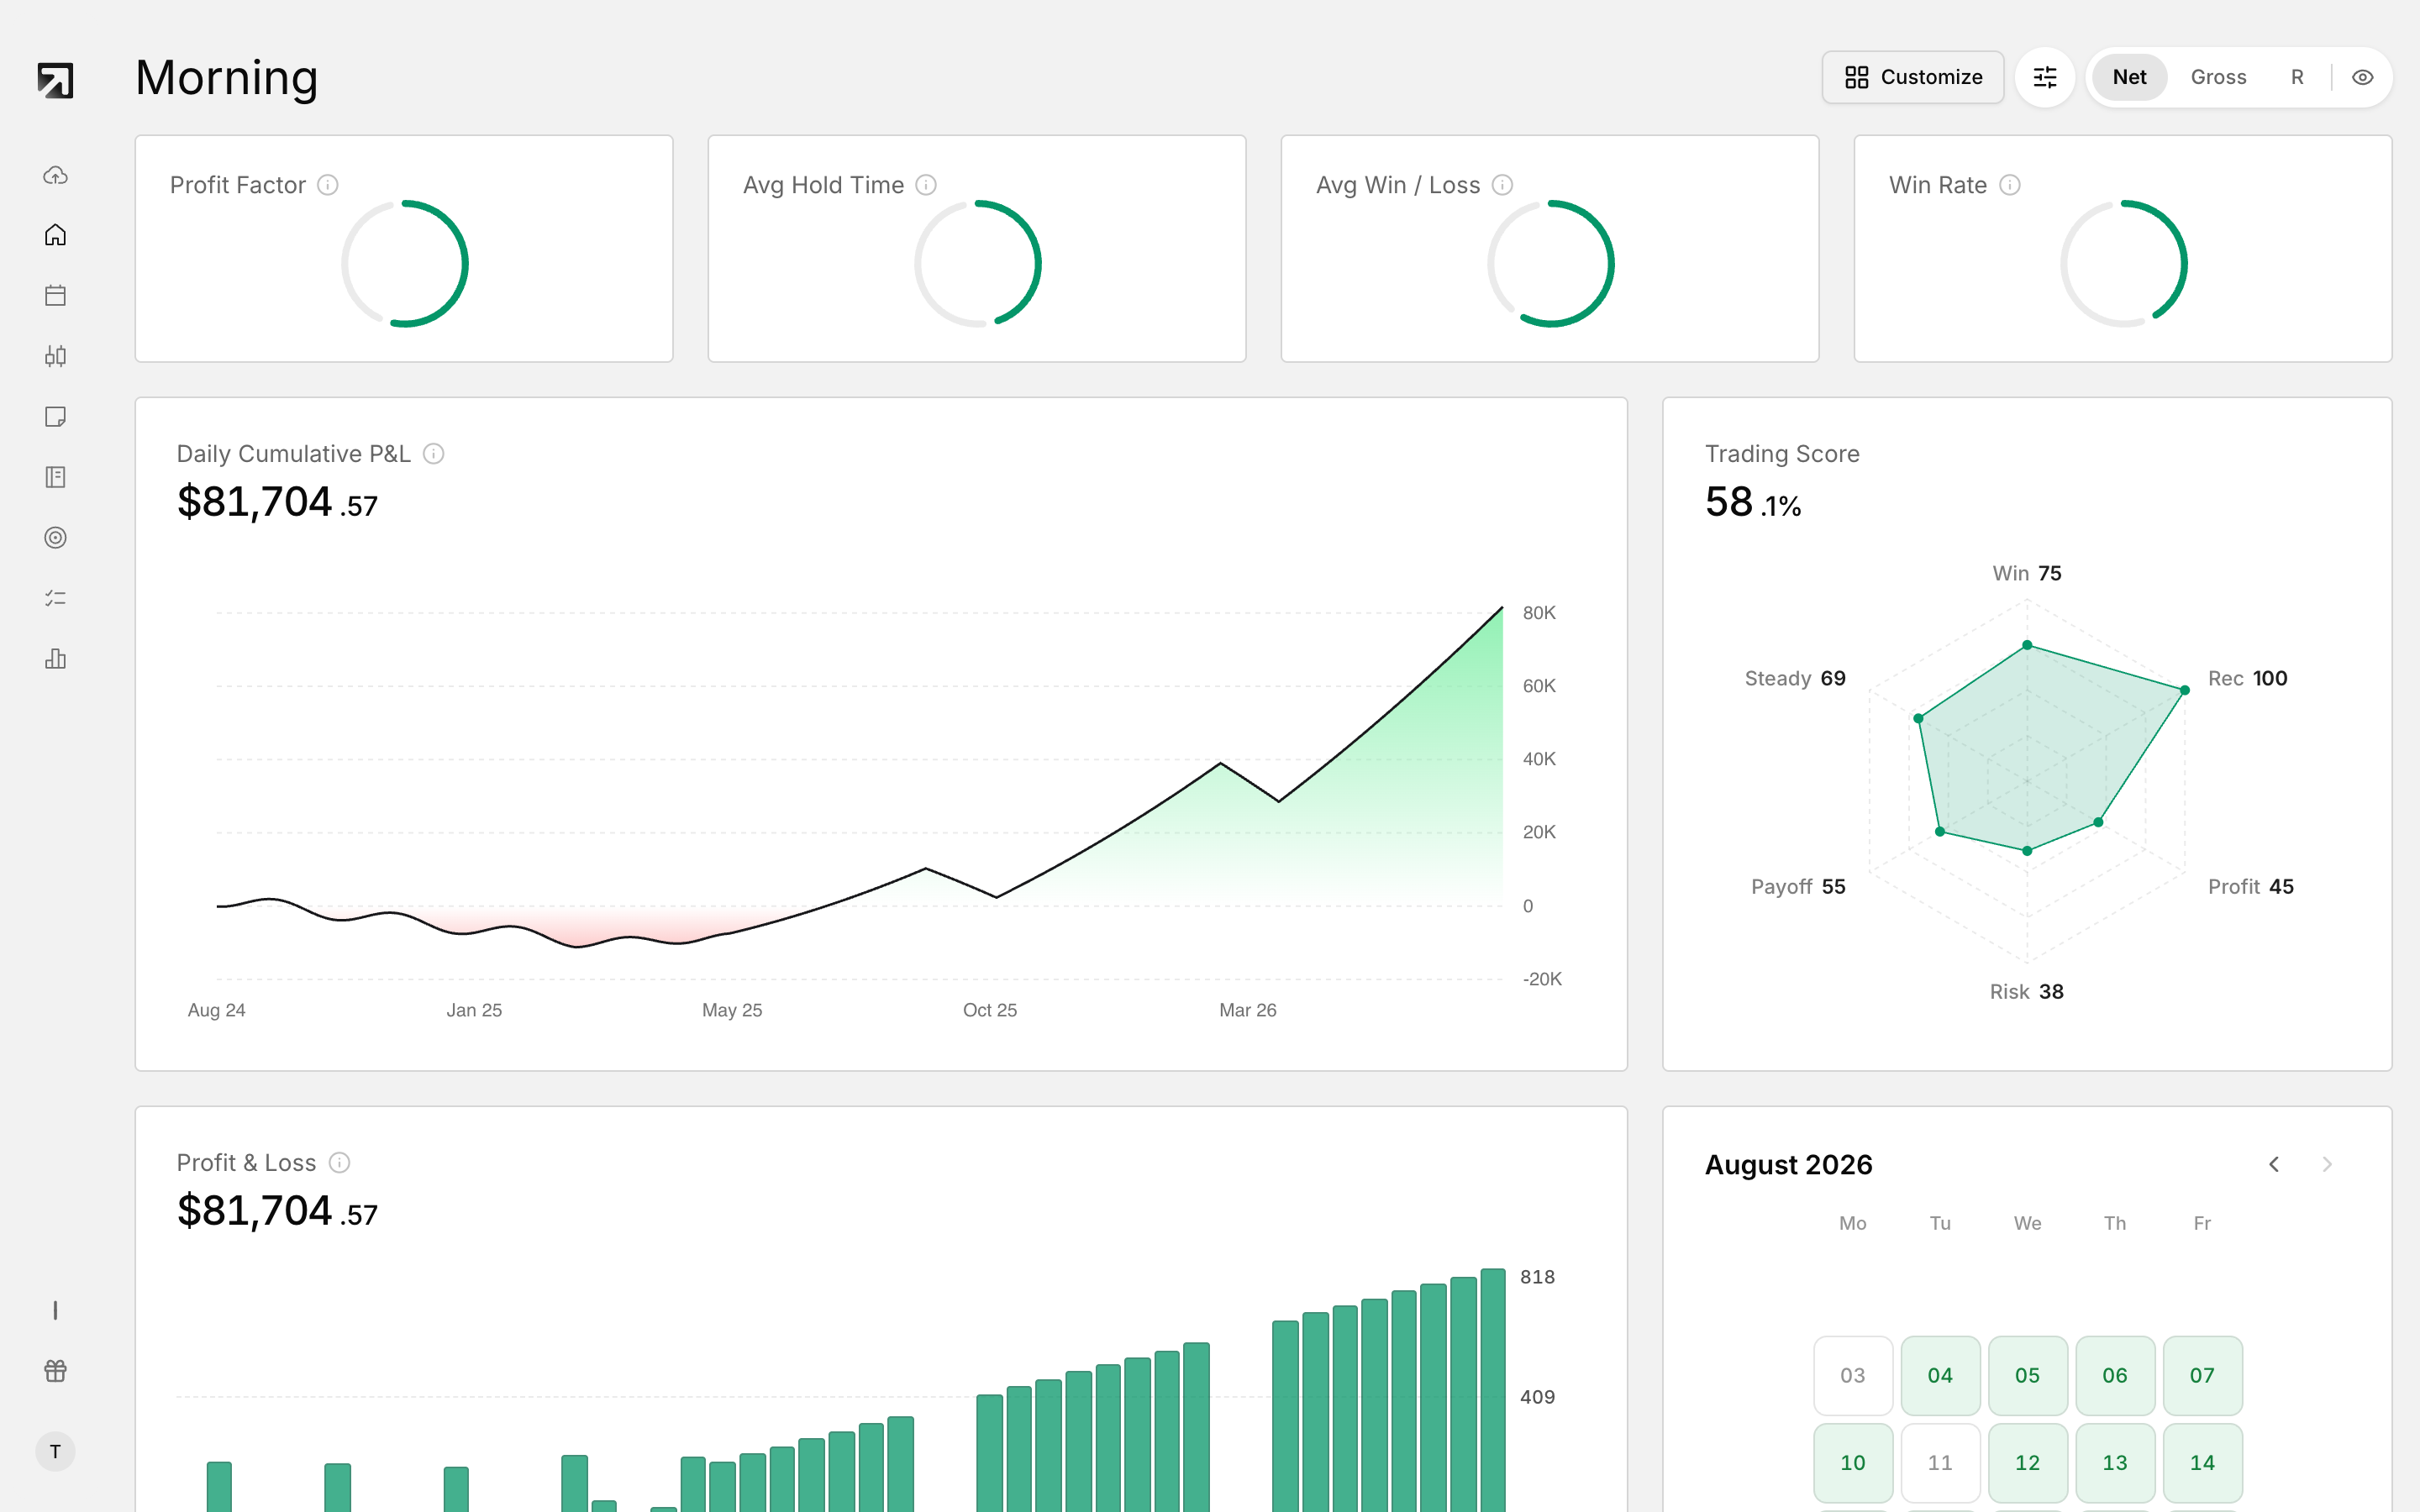 The Dashboard, with widgets for cumulative P&L, trading score, daily P&L and the month calendar.
View modes
Dashboard numbers can switch between Net P&L, Gross P&L and R-Multiple.
Stat cards
Stat cards sit in the upper row. You can show up to 4 at a time.
| Widget | What it shows | | --- | --- | | Profit Factor | How your winning P&L stacks up against your losing P&L. | | Avg Hold Time | Average hold time for winners vs losers. | | Avg Win/Loss | Your average win size next to your average loss size. | | Win Rate | The share of trades that finished as winners. |
Chart widgets
| Widget | What it shows | | --- | --- | | Cumulative P&L | Your running performance curve over time. | | Trading Score | A score built from Win Rate, Consistency, Profit Factor, Avg W/L and Risk Mgmt. | | Progress Tracker | Your daily discipline score and heat map. | | Daily P&L | Day-by-day profit and loss. | | Calendar Heatmap | A month calendar colored by each day's net P&L and trade count. | | Trade Efficiency | Your last 30 closed trades. The bar is P&L kept; the line is the available range. | | Profit by Hour | Which entry hours are more or less profitable. | | Recent Trades | Your five most recent closed trades. | | Risk Analysis | Average win vs average loss, with expectancy. | | Trade Duration | How long your trades last next to their P&L. | | Hour of Day | Performance broken down by start hour. | | P&L Distribution | How often wins and losses fall into different size buckets. | | P&L Projection | Your actual P&L curve next to projections without each mistake. | | Day of Week | Which weekdays you perform best or worst. | | Most Traded Symbols | The symbols you trade most often. | | Symbol Performance | Winning and losing symbols side by side. | | Tag Breakdown | Your top 8 tags by absolute net P&L. |
Customize the layout
- On the Dashboard, open Customize.
- Select Edit Layout.
- Drag widgets to swap positions, or remove a widget with the x.
- Click Add Widget to open Add or Remove Widgets.
- Filter with All, Stat Cards or Charts, then toggle widgets.
- Click Done, then Save.
You can also choose Reset to default.
Save and switch templates
- Open Customize, then Templates.
- Click a template row to switch layout.
- To create one, type a name and click Create.
- Rename with the pencil control.
- Delete is available only when you have more than one template.
When the Dashboard looks empty
- No accounts selected — select one or more accounts from the sidebar.
- No Trades Match Your Filters — import trades or reset your filters.