
The trade chart shows the underlying stock price series, not the option contract's own price. Your option buys and sells still plot as entry and exit markers on that underlying chart.
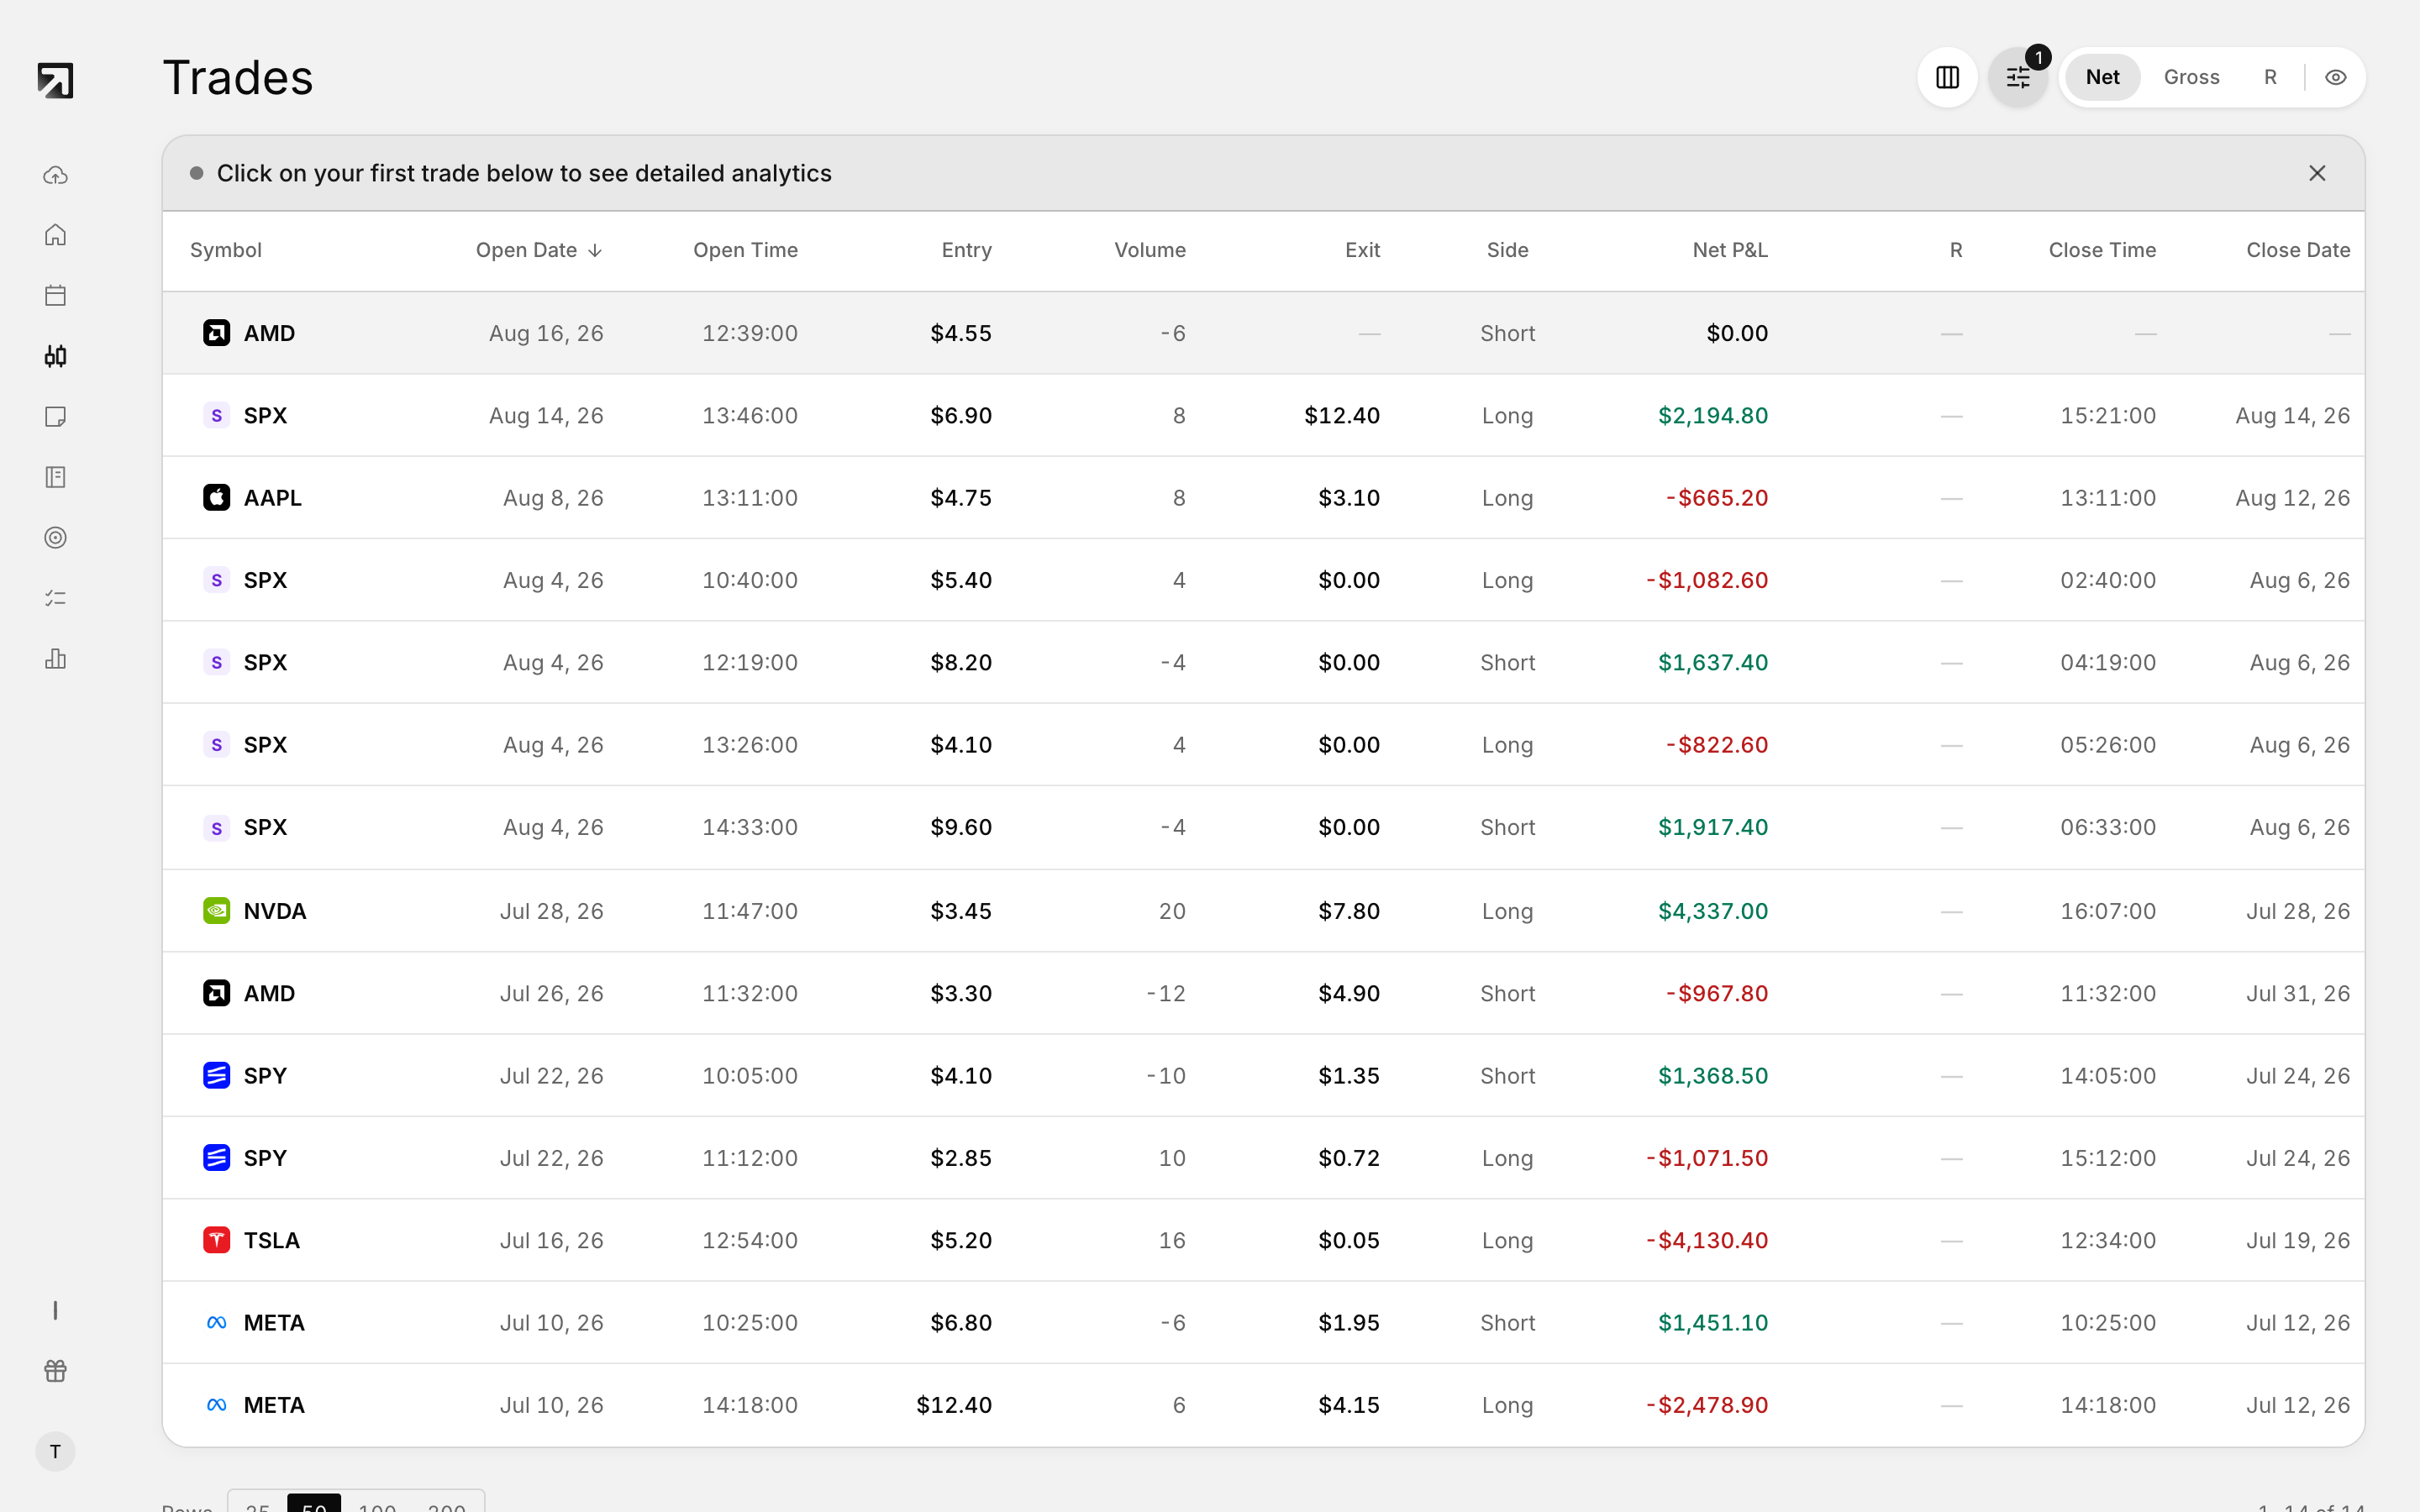 Option rows are priced on the contract, not on the underlying.
What the chart loads
- Option symbols in the form root plus date plus call/put plus strike are detected automatically.
- The chart uses the underlying root as the chart symbol, so you see the stock move, not the option premium series.
- Non-option symbols chart as themselves.
How entry and exit markers appear
Markers come from your option trade executions and sit on the underlying chart at each fill's time and price.
- BUY — right-pointing arrow in green
- SELL — left-pointing arrow in red
The markers are your option fills; the candles are the underlying.
When the chart cannot load
- No data —
No chart data available for {symbol} - Chart library error — the chart failed to load