What Is Technical Analysis in Trading?
Technical analysis is the study of price and volume on charts to plan entries, stops, and targets. In 2026, traders apply the same basic framework across stocks, futures, forex, crypto, commodities, and indices. A 200-day moving average may help define the broader trend, while shorter timeframes help with entry timing.
Technical analysis focuses on what traders are doing in the market now. The main inputs are trend, support and resistance, momentum, volume, and market structure. It does not estimate what a company should be worth. It studies how price is behaving.
The approach works across instruments such as ES, NQ, MNQ, EUR/USD, Bitcoin, crude oil, and the S&P 500. The market changes, but the process stays similar.
Technical Analysis vs. Fundamental Analysis: What's the Difference?
Technical analysis uses charts to time trades. Fundamental analysis uses financial and economic data to estimate value. Active traders often rely more on technical analysis, while long-term investors often place more weight on fundamental analysis. The two methods answer different questions.
Approach
- Technical Analysis
- Price action, volume, and market structure
- Fundamental Analysis
- Financials, macroeconomic data, industry, and valuation
Data Sources
- Technical Analysis
- Charts, volume, order flow proxies, and indicators
- Fundamental Analysis
- Earnings, guidance, balance sheets, and economic data
Time Horizon
- Technical Analysis
- Minutes to months
- Fundamental Analysis
- Months to years
Focus
- Technical Analysis
- Trend, momentum, and supply and demand zones
- Fundamental Analysis
- What the asset should be worth
Aspect | Technical Analysis | Fundamental Analysis |
|---|---|---|
Approach | Price action, volume, and market structure | Financials, macroeconomic data, industry, and valuation |
Data Sources | Charts, volume, order flow proxies, and indicators | Earnings, guidance, balance sheets, and economic data |
Time Horizon | Minutes to months | Months to years |
Focus | Trend, momentum, and supply and demand zones | What the asset should be worth |
Who Was Charles Dow and What Is Dow Theory?
Dow Theory says that markets move in trends, price reflects available information, and volume helps confirm a move. Charles Dow developed the framework more than 100 years ago. The charting tools have changed, but the main ideas remain in use.
Dow Theory includes four ideas:
Price reflects what the crowd knows and what it expects to happen.
Trends have primary, secondary, and minor movements. A trend continues until the market gives a reversal signal.
Volume shows how much participation supports a move.
Confirmation across markets matters. If one index breaks higher while related indices do not, the signal is weaker.
Tools such as TradingView and TrendSpider make this analysis faster. Scanners can detect more than 220 patterns, but a pattern still needs context. Trend, level, and volume decide whether it is worth trading.
What Are the Core Principles of Technical Analysis?
Technical analysis is based on the idea that traders often react to the same levels and patterns. Those repeated reactions can create recognizable behavior in price and volume.
Price reflects available information quickly.
Markets trend, consolidate, and trend again.
Trader behavior repeats because traders respond to familiar conditions.
Volume can confirm or weaken a price move.
Sentiment can increase volatility and push price beyond reasonable levels.
The framework applies across markets, but liquidity, trading sessions, and volatility differ. ES at 9:30 ET behaves differently from EUR/USD at 3 AM.
How Do You Identify Support, Resistance, and Trend Structure?
Support is an area where buyers previously entered. Resistance is an area where sellers previously limited price. Traders commonly look for reactions at these zones or breaks through them.
Useful levels often come from prior swing highs and lows, clean consolidation ranges, and round numbers such as $50, $100, or 1.2000 in forex. A zone that holds several tests without breaking usually receives more attention than a level price crossed once.
How Do Trendlines and Channels Work?
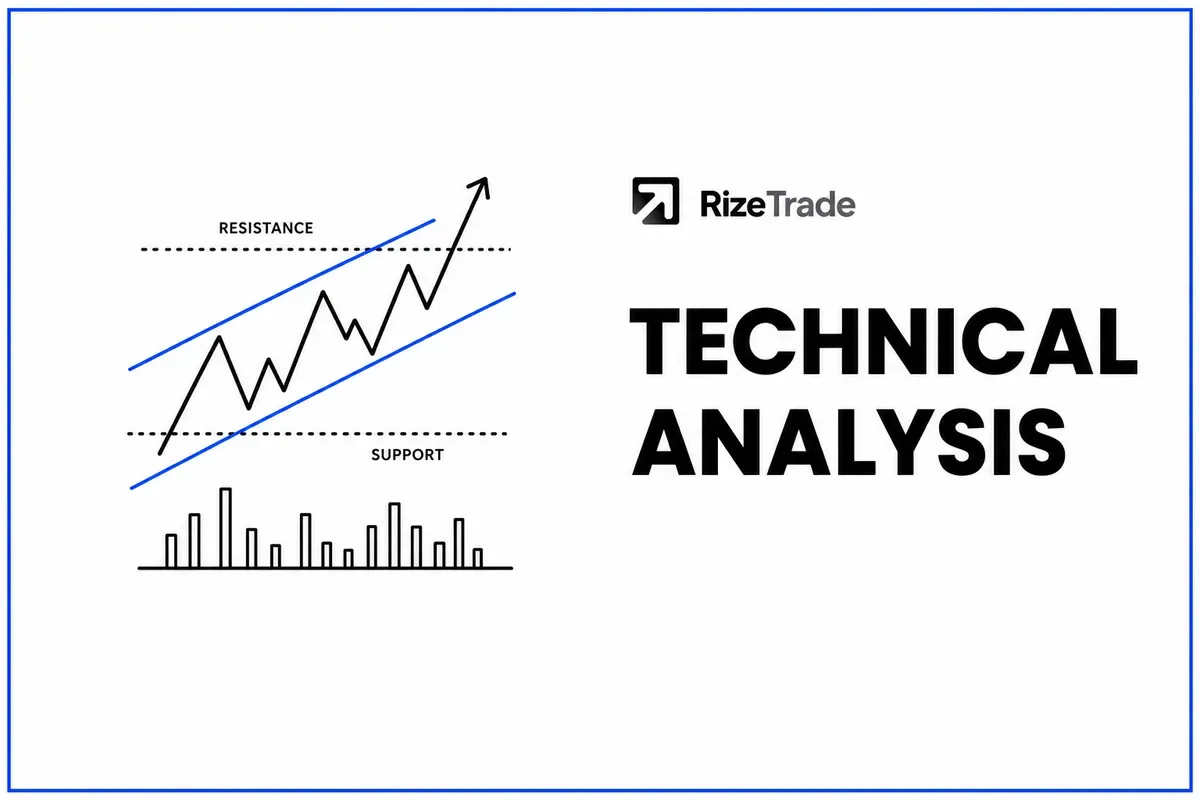
Trendlines mark areas where the market repeatedly defends higher lows or lower highs. Channels add a second boundary, which can help plan entries and exits.
Trendlines do not need to mark an exact price. Their purpose is to show where buyers or sellers keep entering. In an ascending channel, a trader may look for an entry near the lower boundary and a target near the upper boundary. That plan changes when the structure breaks.
Every trend eventually ends. A trendline is a guide, not a guarantee.
How Do You Use Fibonacci Retracement Levels?
Fibonacci retracements mark common pullback areas inside a trend. They are reference points, not automatic buy or sell signals.
38.2%: a shallow pullback that can appear in a strong trend.
50%: a midpoint that often attracts price.
61.8%: a deeper retracement where the trend may either hold or begin to fail.
Extensions such as 127.2% and 161.8% can provide target areas after price clears a prior high or low, especially when there is no obvious resistance nearby.
How Do You Combine Levels, Candles, and Volume?
A level becomes tradable when it has a clear trigger and supporting evidence. The level by itself is not enough.
A trigger might be a rejection wick, an engulfing candle, or a break and retest. Volume can then show whether other traders participated in the move. Breakouts from clear ranges have a better case when volume expands and the higher timeframes already point in the same direction.
Mapping levels across several timeframes also makes risk easier to define. The trade's potential reward becomes measurable rather than theoretical.
How Do You Build a Trading Strategy Using Technical Analysis?
A technical analysis strategy sets rules for entry, stop placement, target selection, and position size. Clear rules are easier to test and repeat than a chart crowded with indicators.
A usable strategy should explain when to enter, when the idea is invalid, how much to risk, and where to exit. Repetition and review matter as much as the setup itself.
How Do You Choose Entry and Exit Points?
Entries often improve when trend, level, and trigger point in the same direction. Exits should follow market structure, planned risk, and the point where the trade idea is no longer valid.
A breakout above resistance or below support can provide an entry, but waiting for confirmation may reduce early false breaks. Buy stops above a breakout level and sell stops below a breakdown level can help avoid entering before the market has moved through the trigger.
Risk to reward is part of the decision. If the next logical target does not offer at least 1.5:1 or 2:1, the trade may not justify the risk. A long trade might use a stop below support. A short trade might use a stop above resistance. The stop belongs where the trade idea is wrong, not where it feels comfortable.
What Are High-Probability Pattern Trading Signals?
A stronger pattern signal usually forms at a meaningful level, follows the higher-timeframe trend, and has momentum and volume support.
A bullish engulfing candle at support, an RSI recovery from below 30, and a volume spike can support a long setup.
A bearish MACD cross at resistance with a bearish candle can support a short setup.
A wedge or flag break with expanding momentum and volume can support a continuation trade.
Any one signal can fail. Several signals at the same location give the setup more context, but they still do not remove risk.
How Does Elliott Wave Theory Work in Trading?
Elliott Wave describes a five-wave impulse followed by a three-wave correction labeled A, B, and C. Traders often use it to study structure rather than to count every move with precision.
Impulse waves move with the trend, while corrective waves move against it. Wave 3 is often the strongest part of an impulse, and Wave 4 is a pullback before the next leg. In practice, wave counts become subjective in choppy futures sessions and crypto markets. A wave count should not determine position size or risk on its own.
How Do You Build and Backtest a Trading Plan?
Backtesting checks whether a set of rules worked on historical data. Forward testing checks whether you can execute those rules in live conditions. Both tests have a place.
Start with historical data. If the rules do not work there, they are unlikely to work in a live account. Then forward test with small size so you can observe execution, slippage, and emotional responses.
Record screenshots, entry reasons, stop placement, and outcomes in a journal. After a few dozen trades, the record can show which conditions helped and which only looked convincing at the time. Memory is not a reliable performance log.
How Do You Combine TA Signals for Better Trades?
The edge in technical analysis comes from combining signals, not searching for one perfect indicator.
A trend, level, momentum reading, and volume confirmation describe a different trade from an RSI reading taken in the middle of a range. The location of the signal matters as much as the signal itself.
How Does Dow Theory Apply to Modern Markets?
Dow Theory applies to modern price action through accumulation, public participation, distribution, and confirmation across related markets.
Accumulation describes a period when larger participants build positions. Public participation tends to increase once the trend becomes easier to see. Distribution occurs when late buyers enter while other participants sell into the strength.
Confirmation across indices remains useful. If the Dow breaks higher but transports or the wider market do not confirm the move, the breakout has less support. Elliott Wave provides another way to describe crowd behavior through five-wave impulses and three-wave corrections.
How Do You Do Multi-Timeframe Analysis?
Use higher timeframes for market bias and major levels, then use lower timeframes to plan entries and manage risk.
Monthly and weekly charts can define the broad trend and major zones. The daily chart shows the working structure. One-hour and 15-minute charts can then help with entry timing.
When timeframes point in the same direction, the trade has more room to develop. When they disagree, the market is more likely to chop. A daily uptrend, for example, may support buying a 1-hour pullback into support instead of chasing a green candle on the 5-minute chart.
What Is a Practical Indicator Stack for Trading?
A practical indicator stack can include one trend tool, one momentum tool, one mean-reversion tool, and volume. More indicators do not automatically produce better decisions.
One common combination is a 200 EMA for the market regime, MACD for momentum, RSI for stretch, and volume for breakout confirmation. The indicators become more useful when they agree with a clear price level.
Market conditions change. Correlations can break and volatility can shift. Test adjustments before changing the rules, and keep risk limits consistent.
How Do Candlestick Patterns Show Market Psychology?
Candlesticks summarize the balance between buyers and sellers during a specific period. The body shows the distance between the open and close. Wicks show where price was rejected. A sequence of candles can show a possible change in control.
Candlesticks contain the same basic data as bar charts, but their bodies and wicks make momentum and rejection easier to scan.
What Are the Most Common Candlestick Patterns?
Doji: a small body that can show indecision. It matters more at a meaningful level after an extended move. Some tests show success rates around 55.9%, depending on the market and the filter used.
Hammer and hanging man: a long lower wick with a small body. A hammer at support can point to a possible reversal. A hanging man at resistance can warn that an uptrend is losing strength.
Engulfing candle: one candle covers the prior candle's body. A bullish engulfing candle into support can show buyers stepping in. A bearish engulfing candle into resistance can show selling pressure.
What Are Advanced Multi-Candle Patterns?
Multi-candle patterns show a change in control across several sessions. The change may lead to a reversal or a continuation.
Morning Star and Evening Star are three-candle reversal patterns that have tested around 55% to 58% under different rules. Harami patterns show compression and hesitation. Three White Soldiers and Three Black Crows show consecutive directional candles. Their location still matters. A pattern after a base or near a breakdown level has more useful context than the same pattern in the middle of a range.
What Is a Price Action Strategy in 2026?
Price action is the study of market structure, levels, and candle behavior at those levels. Indicators can help, but location usually carries more information than the indicator reading alone.
A price action trader may use structure to define the trend, levels to define the trade location, and candles to define the trigger. Multi-timeframe confirmation can keep a trader from taking a 15-minute reversal directly into weekly resistance.
How Do You Set Entries, Stops, and Targets?
Set entries beyond the pattern trigger, stops at the invalidation point, and targets at the next structure level or a defined risk multiple.
Entry: place a buy stop 0.1% to 0.3% above the high, or a sell stop below the low, when the plan requires confirmation beyond the pattern.
Stop loss: place it beyond the point that invalidates the setup. Do not choose a random ATR multiple simply because it feels comfortable.
Profit target: use the next swing level or a 1.5R to 2R plan when the market structure supports that distance.
How Does Volume Confirm Breakouts and Trends?
Volume measures participation. A breakout with rising volume has more support than a breakout that occurs on thin volume, although neither outcome is guaranteed.
If price breaks a level without a meaningful increase in volume, the move may fail. When volume expands with the break, the probability of follow-through may improve. Volume changes the odds. It does not remove the need for a stop.
What Are the Most Important Volume Concepts?
Breakout volume: a genuine breakout often includes an increase in volume. That can reduce the number of false breaks, but it cannot guarantee follow-through.
Volume can lead price: accumulation or distribution may appear in volume before price makes a large move.
Divergence: new highs on falling volume can show that fewer buyers are supporting the trend.
What Are Common Volume Indicators, Such as OBV and VWAP?
OBV and VWAP are two common ways to study participation and price location.
On-Balance Volume, or OBV, tracks whether volume is associated with up closes or down closes. It can help identify accumulation when price has moved very little.
VWAP is an intraday reference based on price and volume. Traders often watch whether price holds above or below it. Holding above VWAP can support a bullish intraday view, while losing it can increase selling pressure.
How Does Volume Improve Pattern Reliability?
A pattern is more reliable when its break includes meaningful participation.
A thin-volume pattern may look convincing on a chart and then fail when regular liquidity returns. A setup formed before the main session on light volume deserves more caution than one confirmed during active trading.
How Do Momentum Indicators Help Time Trades?
Momentum indicators measure how strongly price is moving. They are most useful when combined with trend and support or resistance.
Momentum can help with timing, but it can also mislead traders who ignore the broader trend. An overbought reading can remain overbought during a strong advance, just as an oversold reading can remain oversold during a decline.
How Does RSI Work in Trading?
RSI measures momentum on a scale from 0 to 100. Readings above 70 are commonly viewed as stretched upward, while readings below 30 are viewed as stretched downward.
A stretched reading does not require an immediate reversal. Strong trends can keep RSI above 70 or below 30 for an extended period. RSI works better when paired with structure and levels. Some backtests report win rates around 79.4%, but the result depends on the market, timeframe, and rules.
How Does MACD Work for Trend and Momentum?
MACD uses moving averages to show trend direction and changes in momentum. Crosses have more meaning when they occur at a clear level and within a defined market trend.
MACD includes a MACD line, a signal line, and a histogram. A bullish setup occurs when the MACD line crosses above the signal line and the histogram improves. A bearish setup is the reverse. Standalone accuracy can be modest, with some results around 42.7%. Pairing MACD with RSI and market structure can provide more context.
How Do Traders Use the Stochastic Oscillator?
The Stochastic Oscillator compares the closing price with its recent range. It is most useful in ranges and near support or resistance.
Stochastic can help identify momentum shifts near the edges of a range. It is less useful in a strong trend, where an overbought reading can remain in place while price continues higher.
How Do You Combine RSI and MACD for Signals?
Use RSI to identify stretch and MACD to look for a momentum shift. Take the signal only when the price is at a meaningful level.
RSI + MACD
- Buy Signal
- RSI <30 + bullish MACD cross
- Sell Signal
- RSI >70 + bearish MACD cross
RSI + Price Divergence
- Buy Signal
- RSI <30 + price makes a higher low
- Sell Signal
- RSI >70 + price makes a lower high
Indicator Combination | Buy Signal | Sell Signal |
|---|---|---|
RSI + MACD | RSI <30 + bullish MACD cross | RSI >70 + bearish MACD cross |
RSI + Price Divergence | RSI <30 + price makes a higher low | RSI >70 + price makes a lower high |
Oscillators work best when they agree with the larger trend defined by price structure or moving averages. Otherwise, a trader may try to fade a strong move too early.
How Do Moving Averages Help Identify Trends?
Moving averages smooth price to show trend direction and market regime. They lag because they use past prices, so they confirm more often than they predict.
A moving average filters out some short-term noise. The trade-off is that it will not mark the exact turning point. It may, however, reduce the number of reactions to isolated price spikes.
SMA gives each candle equal weight, so it moves more slowly. EMA gives more weight to recent prices, so it reacts faster.
Common periods suit different horizons. The 20-day average tracks shorter-term movement, the 50-day average is often used for an intermediate trend, and the 200-day EMA helps define the broader regime. Price above the 200 EMA often supports a buy-the-dip approach. Price below it can make rallies more vulnerable to selling.
The Golden Cross occurs when the 50-day average moves above the 200-day average. The Death Cross occurs when the 50-day average moves below it. Neither is a complete entry signal. Moving averages can also act as dynamic support and resistance.
What Are the Main Types of Chart Patterns?
Chart patterns are recurring structures in which price consolidates, reverses, or breaks out. They work best when the pattern forms at a meaningful level and volume supports the move.
A pattern shows how price compresses and releases pressure. The shape matters, but location and confirmation matter more.
What Are Common Reversal Chart Patterns?
Reversal patterns appear when an existing trend begins to lose control.
Head and shoulders: buyers make a final push at the head before the structure breaks lower.
Inverse head and shoulders: sellers lose control as buyers form a base and push higher.
Double top and double bottom: price fails twice near the same level, making a break of that level the potential trigger.
What Are Continuation Chart Patterns?
Continuation patterns are pauses that often resolve in the direction of the existing trend.
Flags and pennants are tight consolidations after an impulse move. They may continue in the same direction when volume and momentum remain supportive. Wedges compress price between converging trendlines and can resolve either way, so the break needs confirmation. Gaps can fill or mark the beginning of another trend leg.
What Are Breakout Chart Patterns?
Breakout patterns form when price builds pressure inside a range and then moves through its boundary.
Ascending and descending triangles show one side holding a level while the other side keeps pressing. Symmetrical triangles are neutral until price breaks out. Rectangles create a clear range with defined boundaries and potential risk points.
Patterns are more useful near prior swing highs and lows, weekly zones, and round numbers than in the middle of choppy price action. Volume and momentum can help filter false breaks. AI scanners can find more than 220 patterns, but the trader still has to judge the location and risk. A measured move projects the height of the pattern from the breakout to estimate a target.
What Types of Price Charts Do Traders Use?
Most traders use candlestick charts because bodies and wicks show momentum and rejection clearly. Line and bar charts can provide simpler views of trend, range, and volatility.
Line charts: connect closing prices. They provide a clean trend view but hide the movement inside each period.
Bar charts: show the open, high, low, and close. They are useful for studying range and volatility.
Candlestick charts: show the open, high, low, and close through bodies and wicks, making momentum and rejection easier to read.
How Do You Choose the Best Trading Timeframe?
The best timeframe matches the planned holding period. A short-term trade and a position trade need different chart views.
Scalping: 1-minute, 5-minute, and 15-minute charts.
Swing trading: 4-hour and daily charts.
Position trading: weekly and monthly charts.
Multi-timeframe analysis connects the views. Use the higher timeframe for bias and major levels, then move down to a lower timeframe for the entry. If the daily trend is higher, a trader may look for a 1-hour pullback into support instead of chasing a 5-minute move.
How Do You Measure Volatility and Market Sentiment?
Volatility shows how far price normally moves, which affects position size and stop placement. Sentiment can identify emotional extremes, but price confirmation still determines the trade.
A volatility change can turn a normal setup into a whipsaw. Traders need to account for it when choosing a stop, sizing a position, and deciding whether the setup offers enough room to work.
What Are the Best Volatility Indicators, Such as ATR and Bollinger Bands?
ATR measures normal price movement, while Bollinger Bands show periods of volatility expansion and contraction.
Bollinger Bands widen as volatility rises and narrow as volatility falls. A move to an outer band can point to exhaustion, but price can also ride the band during a strong trend. Structure is still needed to interpret the move.
ATR shows the recent average trading range. Traders can use it to avoid stops that are too close for current conditions and to reduce position size when volatility expands.
How Does Market Sentiment Affect Price Action?
Sentiment influences volatility and price overshoots. Extreme fear or optimism can precede a reversal, but price still needs to confirm the setup.
Tools such as the Fear and Greed Index can frame sentiment extremes. Panic may precede a bounce, while euphoria may precede a pullback. Fading either condition without a price signal can lead to an early entry.
How Does Volatility Change Trading in 2026?
When volatility changes, traders need to adjust stop distance and position size. One stop size and one strategy will not fit every market condition.
Volatility can rotate between different parts of the market rather than disappearing. A stop and position size that worked in January may not suit October.
High volatility can create larger opportunities, but it usually requires wider stops and smaller positions. Low volatility can feel slow before a squeeze and breakout. Structure, sentiment, and volatility together can make trade selection clearer.
How Do You Master Technical Analysis Over Time?
You improve at technical analysis by applying the same framework, reviewing the results, and adjusting from evidence. The framework is trend, levels, triggers, and risk. Adding more indicators is not a substitute for review.
How Do You Build a Strong Technical Analysis Foundation?
Start with trend structure, support and resistance, entry triggers, and risk. Moving averages can help define the regime. RSI and MACD can help with timing. Volume can show whether a move has participation.
Tools change, including AI scanners, automatic pattern detection, and alerts. The core process remains the same. In a 2026 market with rotations and uneven volatility, traders need flexible tactics and consistent execution.
How Do You Turn Technical Analysis Rules Into Consistent Feedback With a Trading Journal?
A trading journal turns technical analysis rules into performance data. It can show which setups you execute well, where you break your rules, and which market conditions hurt results.
Record the timeframe, entry reason, confluences, stop location, expected target, volume, momentum, and outcome for each trade. This makes it possible to compare the plan with the execution.
Over time, the record can expose habits such as chasing breakouts without confirmation, cutting winners early, or using positions that are too large during high volatility. The data may also show whether the issue is the strategy or the way it is being executed.
Useful measures include win rate by setup, average R multiple, drawdown, and profit and loss distribution. A structured tracker, along with reference material such as FINRA's day trading guidance, can keep notes, screenshots, and statistics in one place. That gives you evidence to use when changing the rules instead of relying on memory.